This article was originally posted on March 16, 2017 to showcase how arts and cultural organizations have been wrongly labeled by some as elitist and irrelevant to Americans. Now for the fourth consecutive year, the Trump administration has threatened to eliminate the National Endowment for the Arts claiming it as a “wasteful and unnecessary” use of funding. We share this piece again to debunk this rhetoric and highlight the true impact that the arts and cultural sector has on society using data to back it up.
This morning, the Trump Administration formally proposed the abolition of federal agencies that support arts and culture, such as the National Endowment for the Arts (NEA) and National Endowment for the Humanities (NEH). Elimination of federal support is not about the money, which only comes to 45 cents per capita for the NEA or .003% of the federal budget. The decimation of federal support is the coup de grâce of a long campaign carefully crafted to infuse public perception with a misleading, conjured notion of arts and culture as something that is irrelevant to most Americans.
During the span of the last twenty-five years rhetoric has intensified, framing arts and culture as elitist and only available and of interest to those with concentrated power, wealth, or an address on the West Coast or Northeast corridor. This rhetoric not only succeeds in diminishing perceptions of the relevancy of arts and culture to American life, it dishonors and invalidates the real experiences with arts and culture that people make part of their lives throughout the country. To quote Robert Lynch, President and CEO of Americans for the Arts (AFTA), “With only a $148 million annual appropriation, the NEA’s investment in every Congressional District in the country contributes to a $704 billion arts and culture industry in America, representing 4.2% of the annual GDP. This arts and culture industry supports 4.7 million jobs and yields a $24 million trade surplus for our country.”[i] Another AFTA article affirms, “The National Endowment for the Arts (NEA) is the largest national funder of nonprofit arts organizations in America. Every $1 of NEA funding leverages $9 in private and public dollars and fuels a dynamic cultural economy and generates millions of American jobs.”[ii]
Figure 1: Location of Nonprofit Arts and Cultural Organizations in the U.S.
with Annual Budget above $50,000, 2015, by Sector
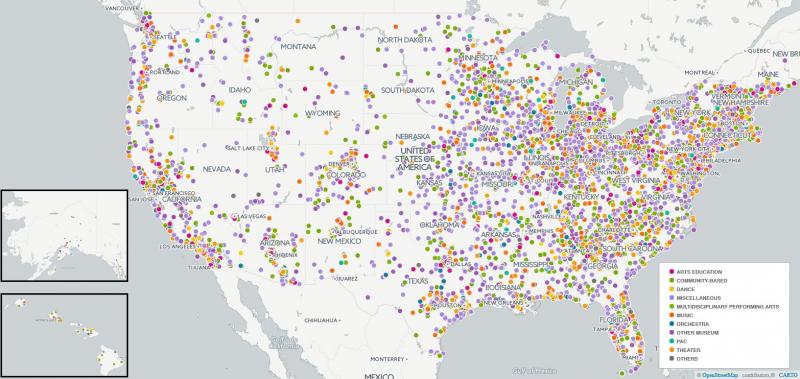
Figure 2: 2010 Population Distribution in the United States and Puerto Rico*
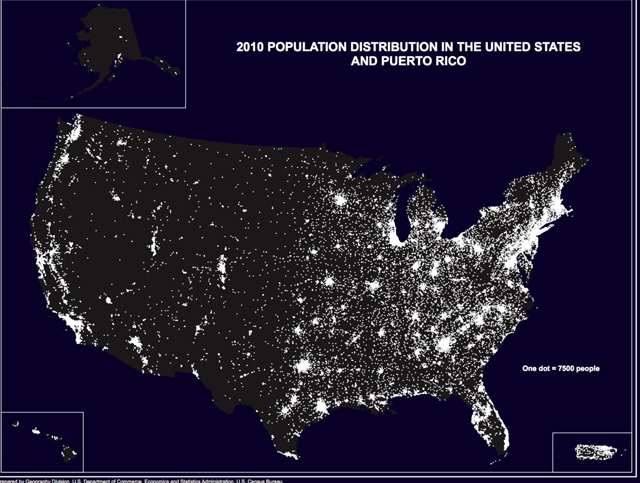
*Source: United States Census Bureau . Accessed 15 March, 2017.
Arts and culture aren’t “out there” and just for an elite part of the population. They are closer and more immediate and personal than most people give them credit for being. Comparing Figures 1 and 2, we see that arts and cultural organizations are where people live, not just in big cities or on the coasts. Every nonprofit arts and cultural sector has its areas to celebrate through the presence of organizations in communities across the country that make possible the artistic and cultural experiences that affect and engage such a large share of Americans (see Figure 1 and Table). Importantly, we recognize that the segment of arts and cultural activity represented in Figure 1 and the Table is just the above-water tip of the arts and culture “iceberg” -- the tip that has been wrongly labeled by some as elitist – and that it under-represents the full universe of artistic and creative activity that Americans enjoy. It captures the activity of nonprofit arts and cultural organizations, the National Center for Arts Research’s (NCAR) focus of study and the basis of findings presented in this report, drawn primarily from IRS 990 forms, which are filed by tax-exempt organizations with budgets of $50,000 or more.[iii]
Table: Universe of Nonprofit Arts and Cultural Organizations in the U.S.
with Annual Budget above $50,000, 2015
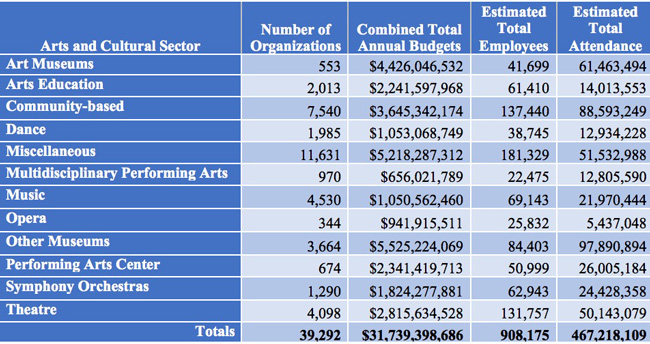
Acknowledging the immutable connection of nonprofit arts and cultural organizations to this rich, diverse and broad foundation of activity that is “beneath the water surface,” we focus in the remainder of this report on the organizations that form the tip of the iceberg (see the Table). Key figures include:
39,292: The number of nonprofit arts and cultural organizations in the U.S. with total annual budgets of $50,000 or more.
$31.7 billion: The total amount spent by nonprofit arts and cultural organizations. This means that these organizations collectively added $31.7 billion to the U.S. economy in the form of direct payments for labor, goods, and services.
908,175: The estimated number of people employed by nonprofit arts and cultural organizations in full-time and part-time positions or as independent contractors. This comes to an average of 23 workers per organization per year. While we report here only on paid workers, we acknowledge the vast contributions of the armies of volunteers who contribute their talents in both artistic and administrative roles.
467,218,109: Estimated attendance at the 39,292 nonprofit arts and cultural organizations (total attendance, not unique attendees). The U.S. population was just above 322 million at the end of 2015,[iv] which might make the 467.2 million attendance figure seem high. However, The National Endowment for the Arts’ A Decade of Engagement[v] estimates that roughly 50 percent of Americans attended a live visual or performing arts activity in 2012. Using this figure as a reference would indicate that the average person who attends an arts and cultural organization in our data makes about three visits per year.
For some, three visits per year for half of the country’s citizens would seem low if this was the totality of arts involvement. Again, it is important to keep in mind that this attendance figure is just the tip of the iceberg of arts involvement, which is inextricably linked with the full spectrum of an individual’s participation in activities described above that lie beneath the water line.
For others, three visits per year may seem high until we consider the landscape of nonprofit arts and cultural organizations, their level of accessibility, and their relationship to every-day life. The data tell us that nonprofit arts and cultural organizations are far more egalitarian than elitist. Figure 1 shows how they are spread across the country. Additionally, the majority of nonprofit arts and cultural organizations can be found in four sectors that are highly accessible and relevant to neighborhood life: Other Museums, Community-based, Theater, and Music.[2] Highlights from the data include:
Other Museums and Art Museums’ contribution to the U.S. Economy: $9.95 billion
The Other Museums sector has 3,664 organizations, including children’s museums, history museums, natural history and natural science museums, and science and technology museums. These family-oriented organizations bring in nearly 98 million attendees per year, the highest cumulative level of all sectors, and they employ over 84,000 workers. Comparing these two facts helps us see that Other Museums served 1,160 attendees per employee, the highest visitor-to-staff ratio, with Art Museums not far behind at 1,474. Other Museums and Art Museums together contributed over $9.95 billion to the U.S. economy through their expenditures on wages, exhibitions, materials, facilities, insurance and services in 2015.
Community-based organizations’ direct contribution to the U.S. economy: $3.6 billion
There are more Community-based organizations than there are organizations in any of the other 11 nonprofit arts and cultural sectors: 7,540. This sector includes multipurpose arts and cultural organizations, cultural and ethnic awareness organizations, folk arts, independent arts and humanities councils and agencies, community celebrations, and visual arts organizations (e.g., nonprofit gallery spaces). The collective magnitude of Community-based organizations’ direct contribution to the U.S. economy in the form of payment for labor, goods and services was $3.6 billion. Together, they provided wages to more than 137,000 workers. Importantly, Americans benefitted from their programs and services 88.6 million times in 2015, some as one-time visitors, some for repeated engagement. Beyond the numbers, Ron Chew’s report titled Community-based Organizations: A New Center of Gravity provides compelling insights on the richness and value of these culturally grounded groups to their communities.[vi]
Reach of Theaters: 50.1 million attendees
There are 4,098 nonprofit Theaters in the country, ranging dramatically in size and scope, from small community theaters to large, professional organizations that are national treasures. There were more than 131,000 workers that received wages from nonprofit Theaters, an employment figure second only to that of Community-based organizations, and these organizations engaged 50.1 million attendees in 2015.
Workers directly employed by Music organizations: over 69,000
The sector with the second most plentiful number of organizations is Music: 4,530. The Music sector includes singing and choral groups, bands and ensembles, and general music organizations (Symphony Orchestras and Opera constitute their own, separate sectors). The Music sector is quite reliant on volunteer labor (e.g., the 32 million people who sing in a chorus each year). Still, over 69,000 Americans work for Music organizations and they attracted 22 million attendees in 2015.
Extended Economic Impact of Arts, Culture, and Federal Funding
Every nonprofit arts and cultural sector has its distinguishing traits, operating models, and areas to celebrate. The facts highlight the extensive touch that nonprofit arts and cultural organizations have in peoples’ lives, whether as employees, contracted artists and workers, attendees, or the merchants whose products and services the organizations purchase in order to deliver their offerings. The figures reported here under-estimate the indirect but real impact of arts and cultural organizations on local communities. For example, the more than 908,000 artists, administrators, production and curatorial staff, arts educators, and other workers paid by these organizations live in communities where they buy homes or pay rent, purchase cars or take local public transportation, are regular consumers of day-to-day products and services, and generally contribute to the local tax base. The more than 467 million attendees often stop at a local restaurant, hire a babysitter, and pay to park in conjunction with their evening out at a performance, day at the folk arts fair or museum, or weekend pottery class.
In addition to illuminating the magnitude, dispersion, and touch points of arts and cultural organizations, the IRS 990 data also reveal that the nonprofit arts and culture field is enhanced by federal funding. Aside from the direct dollars that support community programming and initiatives and the required matching funds that organizations raise from the private sector, federal funding from the National Endowment for the Arts and the Institute for Museum and Library Services has a significant, positive impact that extends beyond dollars. It is a catalyst for both employment and engagement. All else being equal, when an organization receives federal arts funding, those dollars increase employment by 1.5 percent and attendance by 2.7 percent.[3] More national funding for arts and culture would mean that that more Americans could benefit from the jobs and participation stimulated by the federal funding boost.
The Beneath-the-Water Portion of the Nonprofit Arts Iceberg
As formidable as the portion of the nonprofit arts sector that files an IRS 990 is, they are in fact the minority share of the number of nonprofit arts and culture organizations in the U.S. We analyze this group because it can be reliably identified and tracked. There are, however, another 60,000 smaller nonprofit arts and culture organizations that can be found in the IRS Business Masterfile that do not file a 990 because of their smaller dollar size. There are also arts organizations owned by the public sector. The Philadelphia Museum of Art is an example of a municipally owned arts institution. In many smaller communities, the performing arts center at the community college is the major cultural presenter. Nearly half – 45 percent -- of the nations’ 4,500 local arts agencies have public art programs that enliven communities with murals, paintings, sculptures, and statues.
There is, in fact, a wealth of artistic and cultural offerings provided by nonprofit organizations whose primary mission may not lie in the arts but that engage people in a vast array of arts and cultural experiences. Federal arts funding flows to these organizations as well. For example, according to surveys by The Joint Commission,[vii] nearly 50 percent of the nation’s hospitals have active arts programs for their patients. Libraries are home to rotating arts exhibitions. Some of our greatest professional theaters get their starts in church basements, and many communities boast music performance seasons that take place at faith-based institutions. We are increasingly seeing arts programs on military bases to help returning service members in their recovery from Post-Traumatic Stress Disorder (PTSD) and Traumatic Brain Injury (TBI).[viii]
This is in addition to the unincorporated work of the 49 percent of Americans who personally engage in the arts as professional and amateur artists.[ix] Those who sing in a chorus, appreciate that their community arts center sells the pottery class’s bowls as a fundraiser for the homeless, or have a child who has been in a dance recital, know that the arts provide not only personal enrichment but also social cohesion.[x] The majority of arts and cultural organizations accompany houses of worship as places where communities can come together and share a common purpose and activity. Even those who have no direct contact with arts and culture in their lives can indirectly benefit from the positive ripple effect that arts and culture have on community development issues such as public safety and housing[xi] and on making neighborhoods more vibrant and memorable.[xii] The evidence of vibrant arts communities is all around us.
Conclusion
The relevance and contributions of nonprofit arts and cultural organizations to every-day life and community economies are real and much closer than most people realize. Moreover, they represent the easy-to-spot part of the arts and culture “iceberg” that is in clear view. The depth of arts and cultural activity and engagement is even more extensive than that reported here. Retaining and growing federal support for arts and culture first requires shifting public perception to align with reality and taking back control of the rhetoric surrounding its connection to American life. The arts being termed “elitist” is an argument founded in anecdote. The arts being termed small-d “democratic” is the reality revealed to us through examination of the larger set of facts.
Together these organizations provide Americans a rich artistic and cultural legacy, and they enhance local economies while providing citizens a vast array of opportunities to enrich quality of life. Federal support boosts economic enhancement through employment and increases the number of people who benefit from all that arts and cultural organizations have to offer. Funding by the NEA, the nation’s 50 state arts agencies, and 4,500 local arts agencies, is found in communities across the county.
A Note About NCAR and this Report
In report editions, SMU’s National Center for Arts Research (NCAR) provides averages for organizations in the nonprofit arts and cultural field in the U.S. on a variety of performance indices related to financial, operating, and attendance trends and health. It reports on these averages by arts and cultural sector, by organizational budget size, and by geography, and we examine the factors from within the organization (e.g., organizational age, sector, receipt of federal funding, etc.) and its community (e.g., demographic and socio-economic characteristics, number of restaurants and bars per capita, etc.) that help contextualize performance. Organizations can receive their own performance scores relative to organizations like theirs nationally through the KIPI Dashboard.
What NCAR has not done to date is offer aggregate information about the field of nonprofit arts and cultural organizations. NCAR’s vision is to be a catalyst for the transformation and sustainability of the national arts and cultural community, with particular emphasis on nonprofit arts and cultural organizations. So, it is a worthwhile exercise to stop and look at the whole of this community rather than the average experience of its parts.
Understanding the whole of this community, however, means also understanding how it fits into the larger national network of organizations and individuals who cultivate, promote, sustain, and support the arts in America. Americans for the Arts’ mission is to serve, advance and lead this larger network through advocating, researching, and connecting individuals and entities for the purpose of ensuring that every American has access to the transformative power of the arts.
Sustainability partially depends on public awareness and recognition of the field’s presence and magnitude in the country. The field isn’t off somewhere in the distance—it is present in communities across the country.
[1] The authors wish to acknowledge Randy Cohen, Vice President of Research and Policy, Americans for the Arts, for his helpful comments, suggestions and insights.
[2] We intentionally leave out close examination of the extensive Miscellaneous category -- which includes everything from Humanities Organizations to Arts Service Organizations to Historic Preservation -- since its composition is too varied to be useful for drawing practical inferences. Miscellaneous captures all National Taxonomy of Exempt Entities A-Category organizations except Media & Communications that did not fit into one of the other 11 sectors captured in the Table.
[3] Federal funding effects on employment and attendance are both significant at the p<.0001 level.
[i] “Robert Lynch Responds to Wall Street Journal Commentary Calling for an End to the NEA,” Accessed 11 March 2017, http://blog.americansforthearts.org/2017/02/03/robert-lynch-responds-to-wall-street-journal-commentary-calling-for-an-end-to-the-nea.
[ii] Americans for the Arts, “Statement on the Arts, Jobs, and the Economy,” http://www.americansforthearts.org/news-room/arts-mobilization-center/statement-on-arts-jobs-and-the-economy . Accessed 15 March 2015.
[iii] Data on number of organizations and total expenditures are from IRS 990s. Estimates for total employees and total attendance were derived from data from DataArts’ Cultural Data Profile (CDP) (DataArts is a nonprofit organization that empowers the arts and cultural sector with high-quality data and resources in order to strengthen its vitality, performance, and public impact. Any interpretation of the data is that of the authors, not DataArts. For more information, visit www.culturaldata.org), and Theatre Communications Group (TCG), which include attendance and employee numbers for around 6,000 organizations in 2015. IRS data also includes a line item for number of employees but reporting is sparse.
We imputed estimates for missing attendance and employee data using maximum likelihood estimation in a regression model. The independent variables included market-level variables (census bureau estimates of the population, number of arts firms, and number of hotels, restaurants and bars) and firm-level variables (annual budget, contributed revenue, program revenue, and sector). We used CDP and TCG employee and attendance data for the firm-level independent variables if we had it, and IRS data for the remaining organizations.
[iv] https://www.census.gov/popclock/ Accessed 1 March 2017.
[v] Silber, B., and T. Triplett, with S. Iyengar (2015), A Decade of Arts Engagement: Findings from the Survey of Public Participation in the Arts, 2002 - 2012, NEA Research Report #58, The National Endowment for the Arts, January. Accessed 1 March 2017.
[vi] Chew, Ron, Community-based Arts Organizations: A New Center of Gravity (2009), Washington, DC: Americans for the Arts.
[vii] http://www.americansforthearts.org/sites/default/files/ArtsInHealthcare_0.pdf. Accessed 14 March 2017.
[viii] http://www.americansforthearts.org/by-program/reports-and-data/legislation-policy/the-national-initiative-for-arts-health-in-the-military. Accessed 14 March 2017.
[ix] http://www.americansforthearts.org/by-program/reports-and-data/research-studies-publications/public-opinion-poll-overview. Accessed 14 March 17.
[x] See ArtPlace America’s online Library for links to numerous resources, including A. Wali, R. Severson, and M. Longoni’s Finding Cohesion, Capacity and Other Cultural Benefits in Unexpected Places (2002), Chicago: Columbia College, and Volume 10, Issue 2 of the Community Development Investment Review (2014): http://www.artplaceamerica.org/library. Accessed 15 March 2017.
[xi] Ibid.
[xii] Fine Arts Fund, The Arts Ripple Effect: A Research-Based Strategy to Build Shared Responsibility for the Arts (2010), http://www.topospartnership.com/wp-content/uploads/2012/02/Arts_topos_1-10.pdf. Accessed 15 March 2017.