What are the Trends?
Tracking Contribution Sources by Sector, Size, and Market
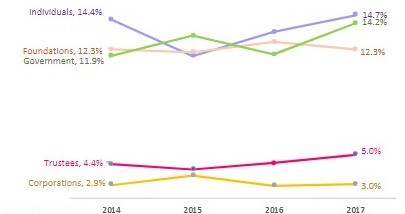
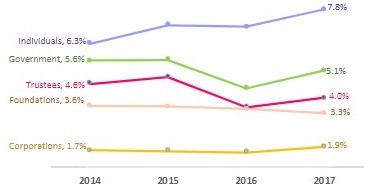
The Greatest Source of Contributions to the Arts: The Individual Donor.
Individuals are the leading source of contributions for the average organization and their giving relative to expenses has gone up in the past four years.
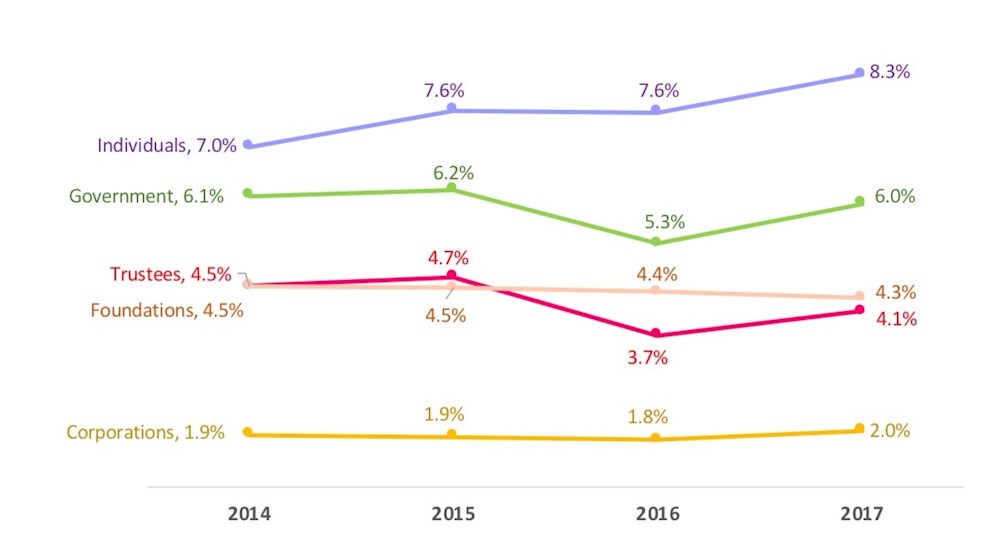
Data Shows Trustees Provide More Resources Than Corporations
- Support from Individuals (non-trustees) exhibited a growth trajectory over the span of four years that outpaced growth in total expenses, with the net result of a 1.3% increase in the Individual Contribution Index.
- Relative to expenses, support from Government agencies, Foundations, Trustees, and Corporations varied less than one percentage point annually and over time, signaling reliability and stability of relationships and consistent commitment.
- Individuals (non-trustees) collectively provide the most funding and corporations provide the least.
- The comparatively small set of individuals who serve as trustees of arts and cultural organizations provide more resources than do corporations, on average.
- The Trustee Contributions and Foundation Support and Government Support Indices were at the highest level of the four years in 2015.
 Consistent commitment and stability is key in managing relationships with trustees, corporations, and government agencies. Relative to expenses, support from each source varied less than one percentage point annually and over four years, while support from individuals grew over time.
Giving Sources Across All Arts Sectors
Overall Trends
Trustee Contributions Index
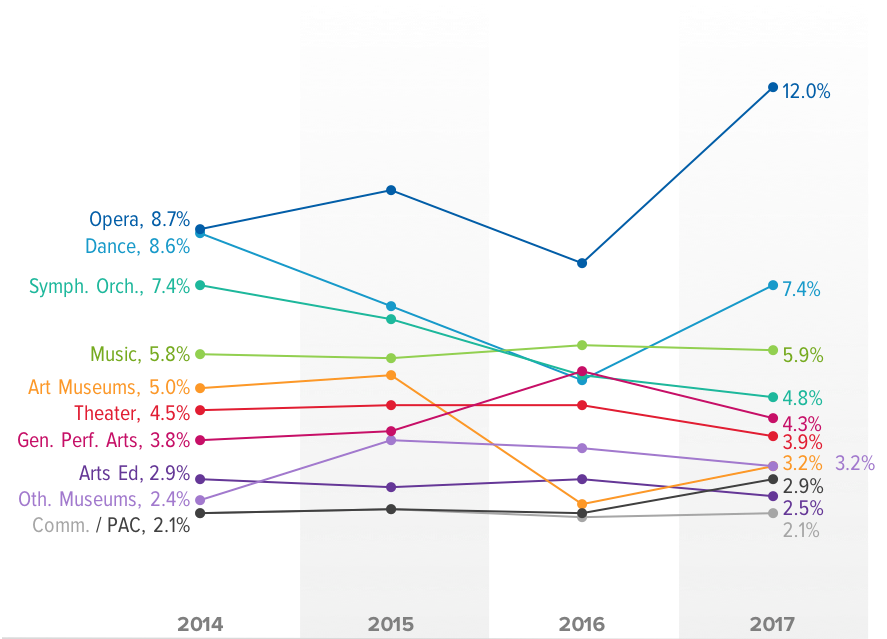
- The trend chart takes a magnified view of differences over time in the trustee contributions index. Some sectors such as Arts Education, Community-based and Music maintained a consistent level of their trustee contribution index over the span of four years without severe highs and lows.
- Symphony Orchestras and Theatres had a slight downward trend in their Trustee Contributions Index.
- Art Museums, Dance and Opera saw a big dip in this index in 2016, followed by an uptick in 2017. Opera made a steep recovery in 2017 with about 3% increase in the index. Outliers pulled the trends down for Art Museums and Dance. Eliminating them would leave a 1.2% increase for Dance and a flat trend for Art Museums.
- Other Museums and General Performing Arts saw their Trustee Contributions index rise over time, although never in a smooth trajectory. Eliminating a General Performing Arts outlier would leave that sector’s performance on this index in a continuous downward trend.
- As shown in this table, the average board size didn’t change much over time for all sectors. There was variation in the percentage of board members who made contributions over time, with the biggest gains seen in the General Performing Arts and Community-based sectors.
Individual Contributions Index
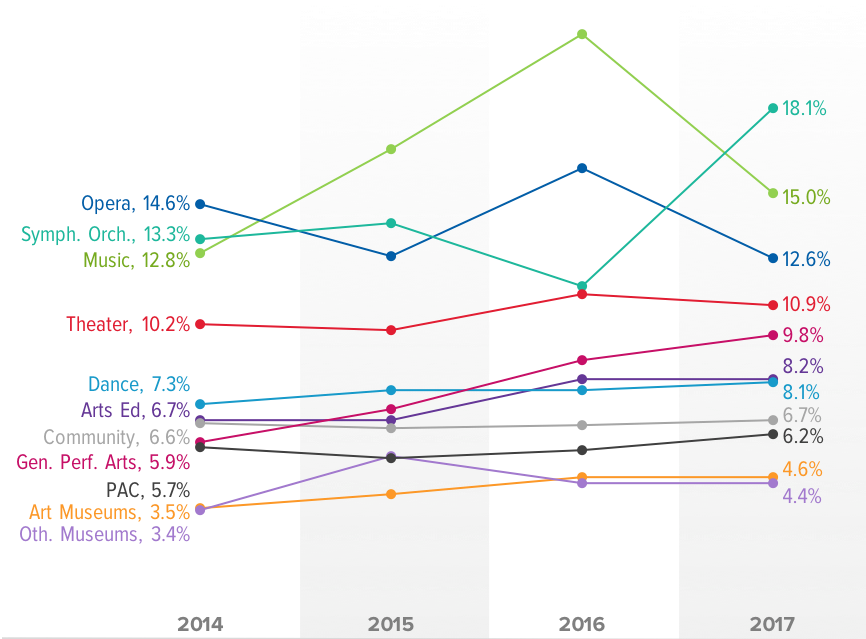
- Some sectors such as Art Museums, Community-based organizations, PACs and Dance maintained a consistent level of their individual contribution index over the span of four years without severe highs and lows.
- Arts education, Theater, and General Performing Arts had an upward trend in their individual Contributions Index over the span of four years.
- Symphony Orchestra saw a dip in 2016 but then made a steep recovery in 2017 with an overall 4.8% increase in this index due to higher individual giving and lower expenses.
- Music and Opera saw their individual Contributions Index spike in 2016 then fall in 2017. For Music, the 2017 decline is the result of both low individual giving and higher expenses whereas for Opera, the 2017 decline is mainly due to reduced individual giving.
- While the Individual Contributions Index for Art Museums and Other Museums is comparatively low, it is important to keep in mind that some membership income is accounted for as earned income to the extent the member receives benefits. For both museum sectors, earned membership revenue covered 5%-6% of expenses each year in addition to the portion of membership revenue counted as individual contributions.
- The Table of Non-trustee Individual Donors, per Sector and Year, reveals that the two museum sectors annually attract contributions from more donors, on average, than the other sectors, with Opera and PACs not far behind.
Corporate Contributions Index
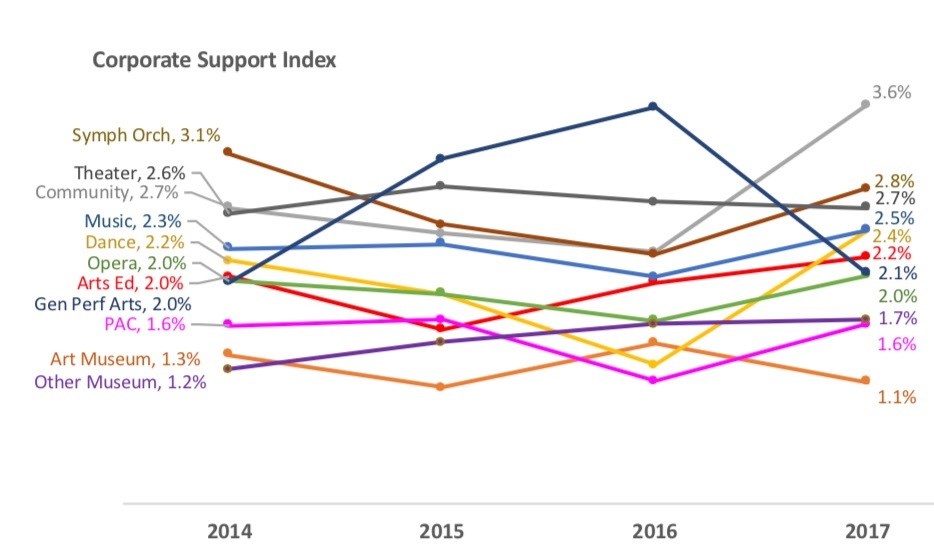
- The trend chart takes a very magnified view of differences over time in the corporate contributions index. The reality is that no sector saw a change of more than 1% in its corporate contributions index over the 4-year period, either positive or negative, and no sector covered more than 3.6% of expenses with corporate contributions, on average. Removing outliers, the 3% mark was exceeded in only one instance during the 4-year period.
- 6 out of 11 sectors saw a dip in this index in 2016: Community-based, Dance, Music, Opera, PACs and Symphony Orchestra due to the combination of both lower corporate giving and higher expenses. All 6 sectors followed this dip with an uptick in 2017.
- Art Museums and Other museums have the highest average number of corporate donors, in the range of 28 to 39 per year, whereas Dance and Music have the lowest, averaging between 4 to 6 annually.
Foundation Support Index
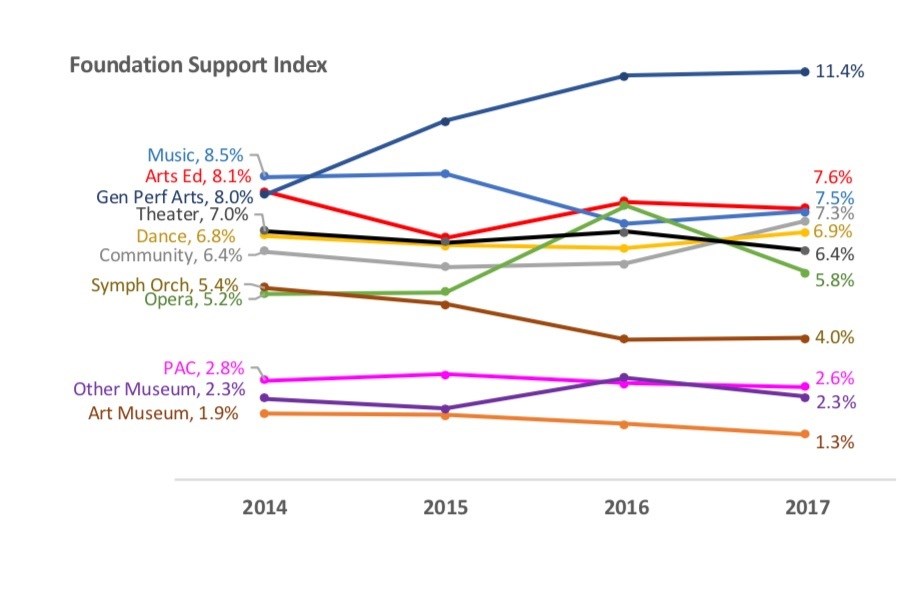
- The General Performing Arts, Music and Arts Education sectors tend to cover more expenses with foundation support than other sectors. There was robust, steady growth in foundation support for the General Performing Arts sector, even after eliminating an outlier from the analyses.
- Aside from the General Performing Arts sector, no other sector saw more than 1% change, positive or negative, in this index from 2014 to 2017 despite fluctuations in interim years.
- Art museums and Symphony Orchestras experienced a consistent, downward trend in their Foundation Support Index.
- Some sectors such as Opera and Other Museums saw a spike in 2016 due to increased foundation giving and then it dipped again in 2017.
- Not surprisingly, Art Museums and Other Museums – the largest-budget sectors on average -- receive funding from the greatest number of foundations annually whereas the Community-based and Music sectors, having the lowest average budget sizes, the fewest.
Government Support Index
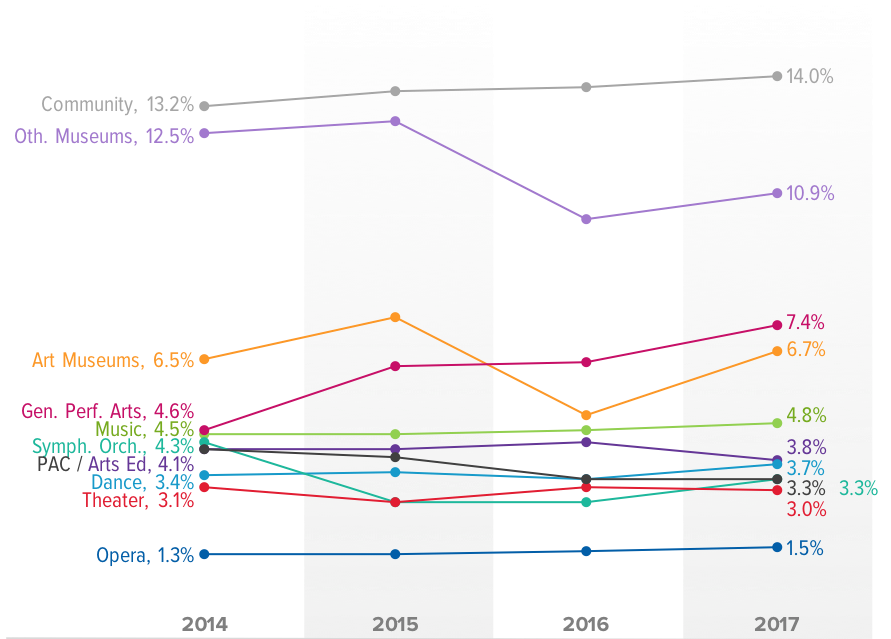
- Aside from the General Performing Arts and Other Museum sectors, no other sector saw more than 1% change, positive or negative, in this index from 2014 to 2017 despite fluctuations in interim years.
- There was robust, steady growth in government support for the General Performing Arts sector, even after eliminating an outlier from the analyses.
- The Community-based sector regularly reports the highest government support index followed by Other Museums. Opera had the lowest government support index annually. Opera companies tend to support less than 2% of total expenses with government funding.
- PACs showed a downward trend in their Government Support Index due to the combination of reduced support and increased expenses.
- Art Museums and Other Museums followed a similar trajectory on this index with an increase in 2015, a drop of 2.6% in 2016, and a slight bump up in 2017.
- With some exceptions, nearly every sector reported an average of zero to two government grants per year. The norm for most sectors is for local funding to be the greatest source of government funding, followed by state funding. The exception is Other Museums where Federal funding is the second greatest source of funding after local government.
Giving Sources by Size
Comparing Small, Medium, and Large organizations
Small Organizations
- The biggest funding sources for Small organizations are non-trustee Individuals, foundations and government.
- Growth in unrestricted contributions from non-trustee individuals, corporations and foundations lagged inflation by 1.6%, 1.7% and 3.8%, respectively.
- By contrast, trustee giving and government support experienced robust growth.
- Of the five sources, the Corporation Contributions Index is consistently the lowest.
- Overall, the Foundation Support Index remained virtually flat over the span of four years, with the same starting and ending figures from 2014 to 2017.
Medium Organizations
- The biggest annual funding sources for Medium organizations are, in descending order, non-trustee Individuals, Government, and Foundations.
- The Government Support Index was the only one to increase more that 1% over time.
- Of the five sources, only the Corporate Support Index lost ground over the span of four years.
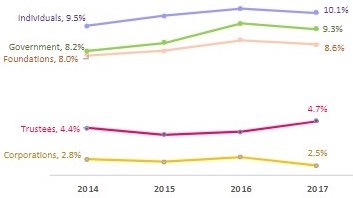
Large Organizations
- The only area of real growth for Large organizations was individual contributions, which supported 1.5% more of expenses in 2017 than in 2014.
- Of the five sources, the corporate contributions were consistently the lowest and the individual contributions were consistently the highest funding source each year.
Giving Sources Across the Country
Tracking trends by geography
Trustee Contributions
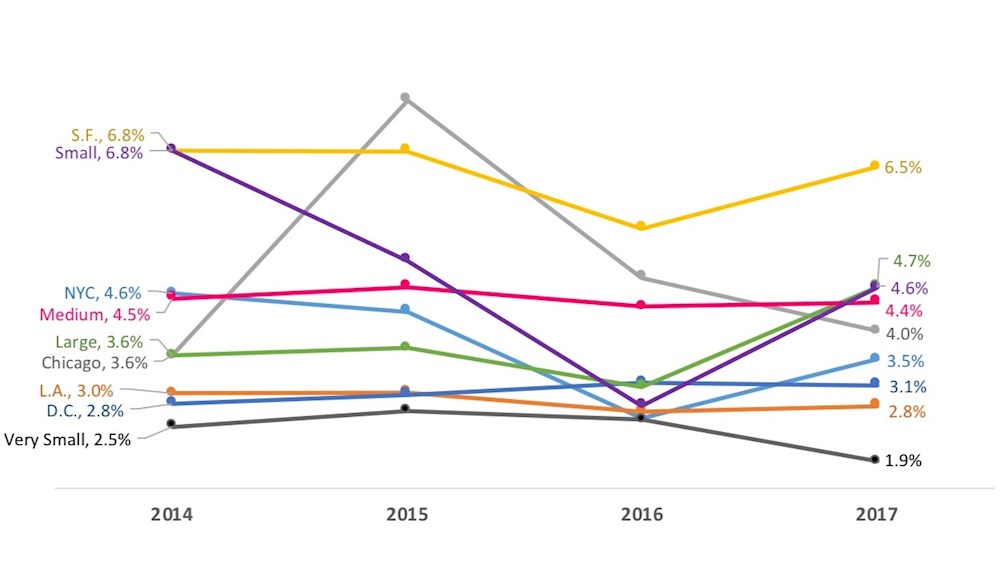
- Contributions from trustees cover between 2% to 7% of expenses, depending on the market.
- Trustee contributions covered a higher percentage of expenses over time for the average organization in Chicago, DC, and Larger Markets.
- The highest percentage of annual board participation in giving was reported by Medium Markets at a 4-year average of 90%
- Organizations in L.A. tend to report the fewest trustee donors and those in New York, Medium and Large markets the most.
Individual Contributions
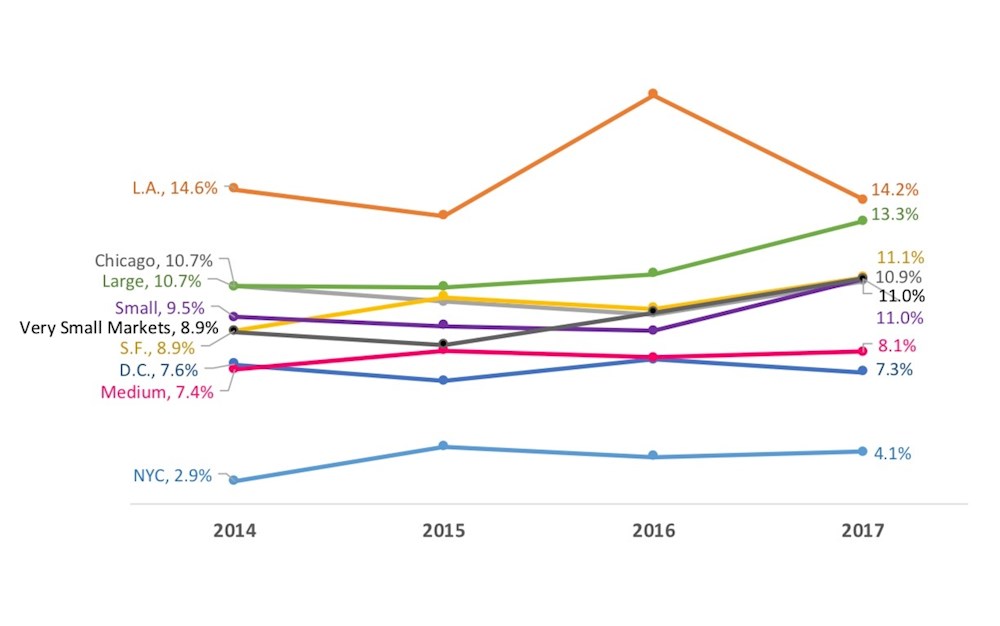
- Los Angeles and Larger Market organizations tend to cover more of their budgets with unrestricted individual contributions annually than organizations in other markets. The spike for L.A. organizations in 2016 is due to an outlier.
- The average organizations in all markets except Los Angeles and DC experienced an increase in its Individual Contributions Index level from 2014 to 2017, despite fluctuations in the interim years.
- New York organizations average the highest number of individual donors annually, and those in Very Small Markets the lowest, a phenomenon that is likely influenced by population size. It is interesting to note that the number of individual donors reported decreased over time in L.A., San Francisco, DC, Medium, Small, and Very Small markets while the Individual Contributions Index in these markets increased. In many markets there was an outlier that skewed the averages high, but eliminating these outliers left the trend direction unchanged in every case.
Corporate Contribution
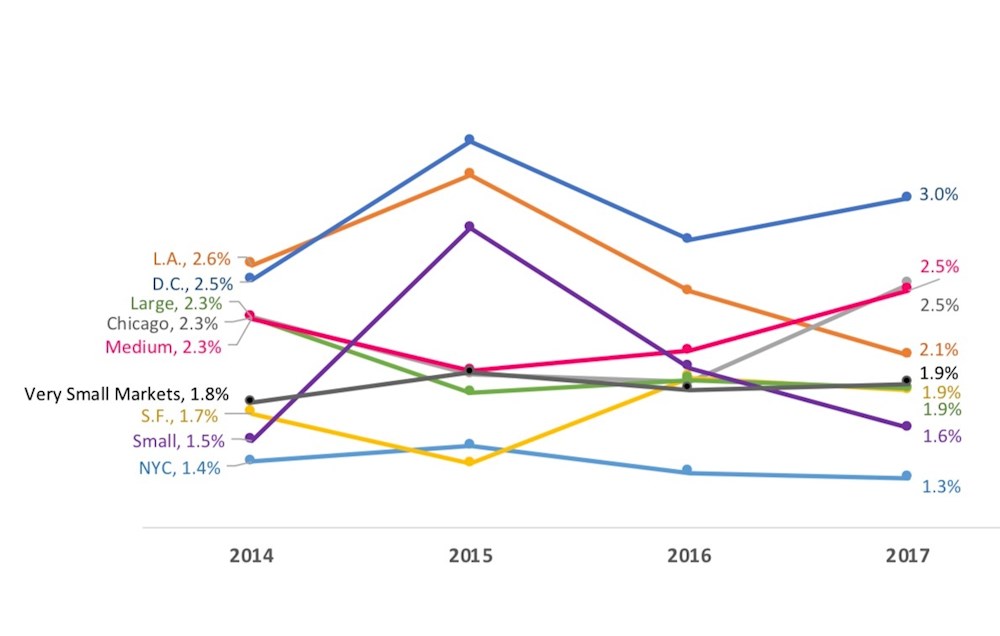
- Since 2015, no market has seen the Corporate Contributions Index exceed an average of 3%.
- DC organizations tend to cover slightly more of their budgets with unrestricted corporate contributions annually than organizations in other markets. This is true regardless of whether an outlier with exceptionally high corporate contributions is included in the analysis.
- There were minor increases in the corporate contributions index over time for all markets except New York, L.A. and Larger Markets, where the index fell marginally from 2014 to 2017. In these three markets, the drop was due to an inflation-adjusted decline in corporate contributions rather than growth in this area being eclipsed by expense growth.
- Of all sources of philanthropy, corporate contributions consistently support the lowest level of expenses for organizations in all markets.
- Organizations in Los Angeles consistently report the fewest corporate contributors while those in New York report the most. The result is that the highest average corporate contributions occur in New York and the lowest in Los Angeles.
Foundation Support
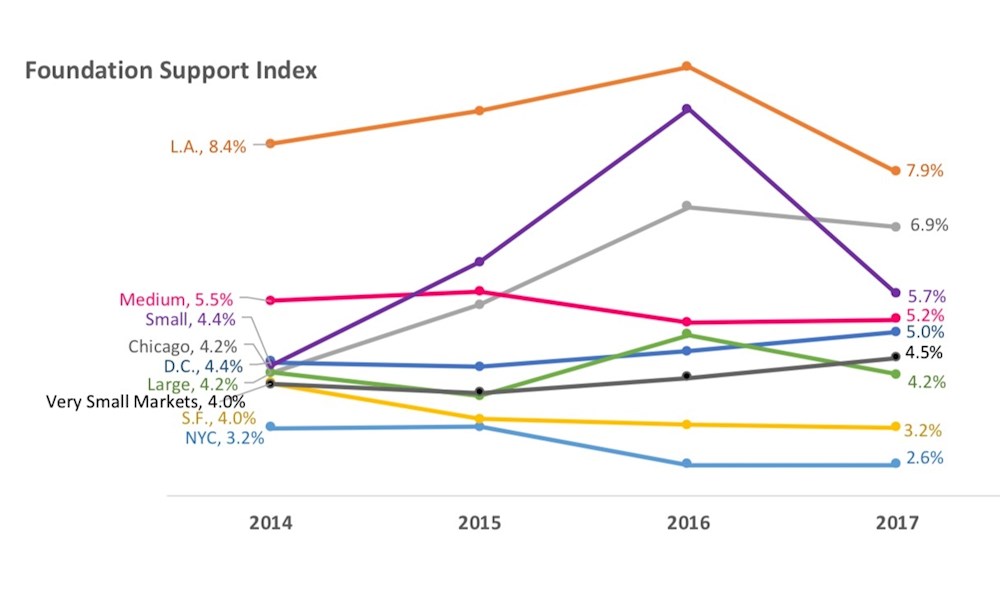
- L.A. organizations tend to cover more of their budgets with unrestricted foundation support annually than organizations in other markets.
- There were increases in the foundation support index over time for all markets except New York, L.A. and Medium Markets, where the index fell marginally from 2014 to 2017. In L.A., the decrease was due to foundation support growth that was lower than growth in expenses, whereas in New York and Medium Markets, growth in foundation support fell short of inflation over time.
- Larger Markets’ Foundation Support Index started and ended the period at the same level despite fluctuations in the interim years.
- The 2016 spike in the Foundation Support Index for Small Markets was due to two outliers.
- Organizations in New York consistently report the most foundation grants while those in Very Small Markets report the fewest. It is likely that local and regional foundations that support arts and culture are relatively scarce in Very Small marketplaces.
Government Support
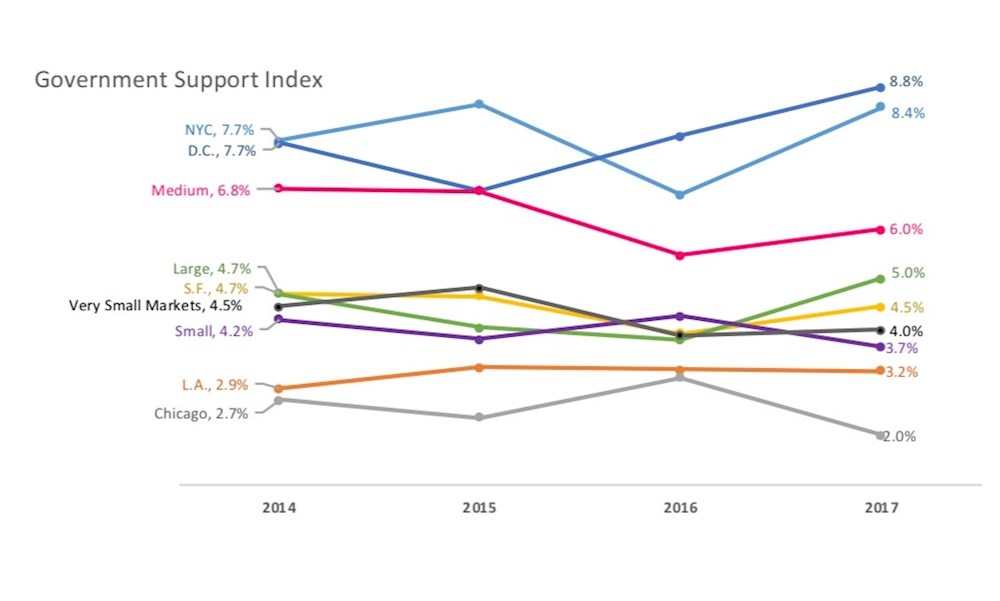
- New York and D.C. organizations tend to cover more of their budgets with unrestricted government support annually than organizations in other markets. L.A. and Chicago organizations cover the least of their expenses with unrestricted government support.
- The majority of the markets saw a decrease in the government support index over time except New York, L.A., D.C. and Larger Markets, where the index was marginally higher in 2017 than in 2014. D.C. organizations had the highest increase in index level over time at 1.1% despite fluctuations in the interim years.
- Organizations in many markets such as New York, San Francisco, Larger, Medium and Very Small markets had a dip in their Government Support Index in 2016.