Our Methodology
While this report focuses on the top arts-vibrant communities, insights drawn from their successes may be applicable and instructive to aid others communities in developing vibrant arts and cultural ecosystems. The use of the term “vibrancy” in this application keeps with Merriam-Webster’s definition of the word to mean “pulsating with life, vigor, or activity”.
We assess communities’ vibrancy through a data-driven approach using data available in all U.S. communities to remove influences of opinion or geographically-limited data on the final results. The vibrancy assessment consists of three main rubrics including supply, demand, and public support for arts and culture, each of which is composed of four detailed measures. We gauge supply as total arts providers, demand with measures of total nonprofit arts dollars in the community, and public support as state and federal arts funding. By using multiple measures, we are able to capture many different components of vibrancy across diverse communities.
The results of this analysis are not based on a simple counting exercise that might benefit areas with higher populations or the most arts and cultural institutions. Adjusting values on a per capita basis as well as accounting for differences in costs of living enable this analysis to level the playing field as much as possible. Large cities and small communities alike can showcase their vibrant characteristics compared to all other communities across the country. In addition to the top Arts-Vibrant Communities listed in this report, Arts Vibrancy scores for every county in the United States can be viewed in an accompanying map to identify arts and cultural strengths that are present in every community.
While our approach to assessing Arts Vibrancy is robust, we readily acknowledge that there are other characteristics of vibrancy that are not possible to capture and assess evenly on a national scale for every community, especially tribal communities. Our measures of supply, demand and government support do not capture artistic quality or the many cultural offerings that take place in organizations whose core missions lie outside of the arts such as hospitals, military bases, libraries, and human service organizations. Additionally, this analysis does not capture participant characteristics or their specific arts and culture engagement habits. We are continually evaluating new datasets for inclusion in our calculations in attempts to capture additional facets of vibrancy within communities. For now, we base the metrics in this report on the most reliable and geographically inclusive sources of data available.
Throughout this report, we will further describe our approach to calculating Arts Vibrancy and contextualize our top-Arts Vibrant Communities. Badges connected with each community indicate whether it has maintained its vibrancy throughout the years or if it is brand new to the list or returning after several years of hiatus. To be released in 2023, a series of in-depth community profiles will highlight the perspectives of arts and cultural leaders from many of these top 40 communities. Even though COVID-19 brought extreme changes to our communities, arts vibrancy did not go dormant throughout the pandemic.
How is Arts Vibrancy Calculated?
Arts and cultural organizations do not operate in a vacuum. They are inextricably tied to their communities. SMU DataArts recognizes this and combines data from nonprofit arts and cultural organizations with data for the communities in which they reside (see endnote i). By geolocating organizations and linking them to their community’s characteristics in the data, we can identify factors that affect the health and sustainability of arts organizations. We know from our research that each of the factors from the ecosystem included in this report has an influence on a variety of financial, operating, and attendance outcomes for arts and cultural organizations. We share our findings regarding the operating and community characteristics that drive performance – and how they affect performance – in our regularly published reports.
Given the symbiotic relationship between arts organizations and their communities, the Arts Vibrancy Index (AVI) can help arts leaders, businesses, government agencies, funders, and engaged citizens understand the overall intensity and capacity of the community’s arts and culture sector. Past AVI reports have helped communities get the recognition they deserve from their mayors, city council members, and state legislators. Arts leaders have informed us that they use the AVI reports and interactive map on our website to consider where to relocate their operations and what markets are ripe for touring performances or exhibitions. Communities can benchmark themselves against an aspirational set of communities and understand what sets them apart by examining the underlying dimensions of demand, supply, and public support for arts and culture. Numerous funders have engaged with the AVI data to better understand how investments to increase arts vibrancy might be best directed in the communities they serve, given existing strengths and opportunities for improvement. The AVI’s multidimensional framework provides insights as to why two cities that seem very different on the surface might be close to one another in the ranking.
There are valuable frameworks that chronicle a neighborhood’s cultural resources such as the Social Impact of the Arts Project’s Cultural Asset Index, the National Endowment for the Arts’ Exploring Our Town Projects, and the Baltimore-focused interactive tool GeoLoom. There are published rankings that assess the strength of arts and culture as part of a larger look at a city’s attractiveness and livability, and others that focus on the arts and cultural sector’s role as part of creative placemaking. We share some metrics with these other studies and tools but, in keeping with SMU DataArts’ mission, our ranking focuses solely on arts and culture with a heavy emphasis on the nonprofit sector.
The measures are drawn from a review of the existing literature on arts and culture indicators and from our Model of the Arts & Culture Ecosystem (see Figure 2), which features a complex and interdependent set of relationships among: 1) artists and arts organizations; 2) their communities; and 3) government funding that influences the production and consumption of arts and culture.
Figure 2: Modeling the Arts & Culture Ecosystem
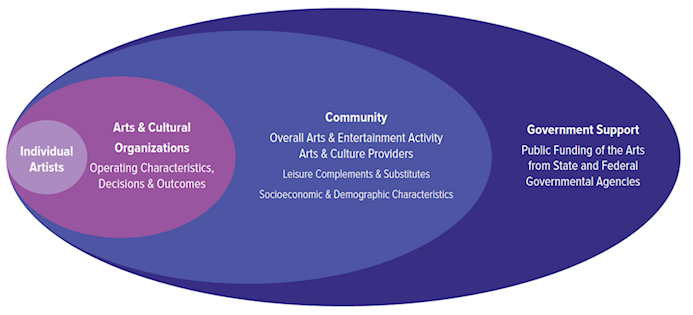
When we look at factors that affect the performance of arts and cultural organizations in our quarterly reports and in the Arts Vibrancy Map online, we include socioeconomic and demographic characteristics and other leisure activities like cinemas, professional sports teams, and zoos. We have intentionally omitted these factors from the AVI Report in order to focus the rankings as purely as possible on arts and cultural activity. It would be inequitable, for example, to penalize a community that is relatively low on per capita income but very strong on arts providers, or to elevate a community that has a relatively high number of professional sports teams and restaurants but few artists or arts organizations.
Key Definitions
We aggregate measures across the 12 arts and cultural sectors that are included in SMU DataArts’ research and KIPI Dashboard: Arts Alliances and Service Organizations, Arts Education, Art Museum, Community, Dance, Music, Opera, Performing Arts Center, Symphony Orchestra, Theater, Other Museum, and Multidisciplinary Performing Arts (see endnote ii). Some sectors combine arts and cultural disciplines with similar characteristics (e.g., Other Museums includes History Museums, Natural History & Natural Science Museums, and Science & Technology Museums, etc.) (see endnote iii).
Communities are defined by the Office of Management and Budget (OMB) as MSAs, or Micro- and Metropolitan Statistical Areas. As described on the OMB website:
“Metropolitan Statistical Areas have at least one urbanized area of 50,000 or more population, plus adjacent territory that has a high degree of social and economic integration with the core as measured by commuting ties.
Micropolitan Statistical Areas have at least one urban cluster of at least 10,000 but less than 50,000 population, plus adjacent territory that has a high degree of social and economic integration with the core as measured by commuting ties.” [Accessed 1 Dec 2022, page 2]
Micro and Metropolitan Statistical Areas are comprised of one or more counties. For this reason, readers will find descriptions of countywide activity in the latter half of this report. The OMB is careful to point out that, since MSAs encompass entire counties, they do not equate to an urban-rural classification since many counties hold both rural and urban characteristics. [Accessed 1 Dec 2022, page 2]
The Census Bureau and other government agencies use MSAs when collecting, organizing, and analyzing data. Focusing on MSAs provides a nationally standardized, objective approach to delineating markets. MSAs are frequently centered on one large city or twin cities, but they capture the network of suburbs that rise up around a city or town rather than considering them separately. A key feature, as quoted above, is the “high degree of social and economic integration with the core as measured by commuting ties.”
For some, the notion of MSAs feels off target because they think about the character of their city in very different terms than they do that of surrounding suburbs or the rest of the county. And yet visitors, audience members, artists, and employees of arts organizations live in the surrounding suburbs, particularly when real estate prices make living in the urban core cost-prohibitive. Off-site production facilities and storage are frequently located in less expensive parts of town that may or may not fall within the city’s official boundaries. Main airports often lie outside of the city limits and yet they serve arts and cultural organizations in the city through air transportation of artists, visitors, and materials. For these reasons, OMB’s approach has practical implications for arts and cultural ecosystems.
Where the OMB breaks down very large MSAs with populations over 2.5 million into Metropolitan Divisions, we do the same. Metropolitan Divisions function as distinct social, economic, and cultural areas within the larger MSA, kind of like MSAs within MSAs. [Accessed 1 Dec 2022, page 2]
To keep consistent across all analyses, we go with Metropolitan Divisions where they exist and note the comparisons with MSAs and with other Metropolitan Divisions for the same MSA. In total, there are 947 unique MSAs and Metro Divisions in the U.S.
Although all measures are calculated on a per capita basis to examine as level a playing field as possible, we report rankings on cities in three size categories rather than compare cities of vastly different sizes: Large MSAs (and Metro Divisions) with populations over 1,000,000; Medium MSAs (and Metro Divisions) with populations of 100,000 to 1 million; and Small MSAs, all of which are Micropolitan Statistical Areas. Taking a per capita approach, and capturing the activity of MSAs rather than cities (i.e., urban cores only), sometimes leads to surprising results.
Metrics and Measures
With this report, our goals are to provide information about metrics that are meaningful and consequential and to stimulate a conversation about how cities vary in their arts vibrancy and the forms vibrancy can take. Arts Providers are a gauge of supply and include the number of independent artists, arts and culture employees, nonprofit arts and cultural organizations, and arts, culture, and entertainment firms in the community. Arts Dollars represent a gauge of demand for nonprofit arts and cultural programming, including earned revenue from program activities, contributed revenue supporting the arts, total compensation to artists and staff, and total expenses. Government grant activity is a gauge of public support for arts and culture, captured as the number of state and federal grants and total government grant dollars in the community.
Table 4 shows what we measured, the sources of data for each measure, and how we weighted each area. We weight Arts Providers and Arts Dollars more heavily than Government Support because of their critical importance to arts vibrancy, as they are indicators of supply and demand. We adjust revenue and expense figures by a cost-of-living index.
Table 4: Index Components (all per capita measures)
| METRIC | MEASURES | DESCRIPTION | WEIGHT |
|
Arts Providers |
County and ZIP code Business Pattern data collected and disseminated by the US Census Bureau. Arts and cultural organization data aggregated from IRS 990s. |
45% |
|
|
Independent artists |
Freelance artists primarily engaged in performing in artistic productions, in creating artistic and cultural works or productions, or in providing the technical expertise necessary for these productions, aggregated at the zip code level |
||
|
Arts and culture employees |
Number of people employed by the museum, historical site, theater, dance, music, opera, and other performing arts sectors, as salaried employees or independent contractors, aggregated at the county level |
||
|
Arts and cultural organizations |
Number of nonprofit organizations in the museum, arts education, community, dance, music, opera, performing arts center, orchestra, theater, multidisciplinary performing arts, or arts alliance and service organization sectors, aggregated at the zip code level |
||
|
Arts, culture & entertainment firms |
Number of arts, culture, and entertainment firms, weighted for size and aggregated at the zip code level. Includes museums, theaters, dance companies, opera companies, music groups and performers, music producers and presenters, fine arts schools, and recording, motion picture, and video production companies |
||
|
Arts Dollars |
Data aggregated from IRS 990s, SMU DataArts’ Cultural Data Profile, and Theatre Communications Group |
45% |
|
|
Program revenue |
All revenue earned due to people participating in the activities of nonprofit arts and cultural organizations* |
||
|
Contributed revenue |
All revenue from contributions to nonprofit arts and cultural organizations (includes public funding)* |
||
|
Total expenses |
All expenses of nonprofit arts and cultural organizations* |
||
|
Total compensation |
All payment to staff and artists by nonprofit cultural organizations* |
||
|
Government Support |
Data collected and disseminated by the National Endowment for the Arts, Institute of Museum and Library Services, and National Assembly of State Arts Agencies |
10% |
|
|
State arts dollars |
All state arts dollar funding in the community* |
||
|
State arts grants |
Number of state arts grants awarded in the community |
||
|
Federal arts dollars |
All NEA and IMLS dollar funding in the community* |
||
|
Federal arts grants |
Number of NEA and IMLS grants awarded in the community |
Because there are 947 unique MSAs and Metro Divisions, any ranking in the top 40 puts that community in the top 5% nationally.
Rankings are ordinal measures – i.e., who made it to the top 40. This provides the order of the results but no information about the degree of difference between the raw measures. This is an important distinction to keep in mind. For example, the community ranked in the top 40 on arts providers might feature a population that is 10% providers while the 41st place community has only 5% of the population who are providers and the 42nd place community has 4.7% providers. The degree of difference between the top 40 community and the 41st is much bigger than the difference between the top 40 community and the 42nd community, and yet the ranking makes them appear to be evenly spread apart. This is why the overall arts vibrancy ranking is not an average of the rankings on the three component metrics and the three component metrics are not an average of the rankings on their underlying measures (see endnote v). We don’t average rankings, we average raw scores.
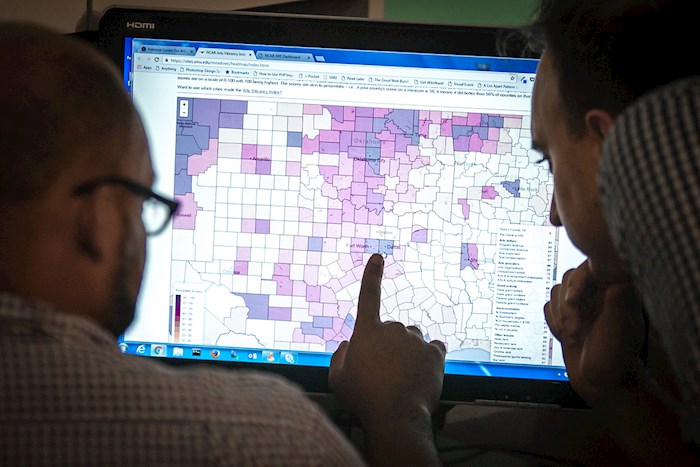
Scores for Every County in America
What factors make up a community's arts vibrancy, and which cities possess them? We provide scores for every county's Arts Dollars, Arts Providers, Government Support, Socio-economic and Other Leisure characteristics on a scale of 0-100 with 100 being the highest. The scores are akin to percentiles - i.e., if your county's score on a measure is 56, it means it did better than 56% of counties on that measure.
ENDNOTES
i The data that SMU DataArts has integrated for this report comes from numerous sources. Organizational data that forms the basis of the Arts Dollar measures is from the Internal Revenue Service, DataArts’ Cultural Data Profile, and Theatre Communications Group. Community data that forms the basis of the Arts Provider measures is from the Internal Revenue Service and the Census Bureau, which is reported by county, zip code, and census tract. State funding data is from the National Assembly of State Arts Agencies and Federal funding data is from the National Endowment for the Arts and the Institute of Museum and Library Services
ii The 12 categories of arts and cultural sectors and their associated NTEE codes are as follows:
Arts Alliance and Service Organizations: Alliances & Advocacy (A01), Management & Technical Assistance (A02), Professional Societies & Associations (A03), Fund Raising & Fund Distribution (A12)
Arts Education: Arts Education/Schools (A25) and Performing Arts Schools (A6E)
Art Museums: Art Museums (A51)
Community: Arts and Cultural Organizations – Multipurpose (A20), Cultural & Ethnic Awareness (A23), Folk Arts (A24), Arts & Humanities Councils/Agencies (A26), Community Celebrations (A27), Visual Arts (A40)
Dance: Dance (A62) and Ballet (A63)
Music: Music (A68), Singing & Choral Groups (A6B), and Bands & Ensembles (A6C)
Opera: Opera (A6A)
Performing Arts Centers: Performing Arts Centers (A61)
Symphony Orchestra: Symphony Orchestras (A69)
Theater: Theater (A65)
Other Museums: Museums & Museum Activities (A50), Children’s Museums (A52), History Museums (A54), Natural History & Natural
Science Museums (A56), and Science & Technology Museums (A57)
Multidisciplinary Performing Arts: Performing Arts (A60)
iii We assign organizations to arts sectors using the National Taxonomy of Exempt Entities (NTEE), which is a classification system for nonprofit organizations. The NCCS website gives an excellent summary description of what NTEEs are and how they came about: http://nccs.urban.org/classification/NTEE.cfm
Organizations report their NTEE when filing their IRS 990 and they report it as part of DataArts’ Cultural Data Profile survey. If an organization has a parent organization, we opted for its arts discipline NTEE (e.g., performing arts center) rather than its parent organization’s NTEE (e.g., university) if available. “Arts and Culture” is one of the NTEE’s 10 major groups of tax-exempt organizations (the “A” category), and within Arts and Culture there are 10 subcategories that contain 30 additional subdivisions.
iv See i above.
v All measures are calculated on a per capita basis, and all financial measures are adjusted for cost of living. To combine measures for score calculations, we standardize each metric using factor analysis. The factor analysis process applies weights to the measures based on the calculated “quality” of each measure. The weighted measures are then combined to create a standardized factor score for each of the metrics. The standardized scores have means of zero and standard deviations of one. Once the three metrics are standardized, we weight them 45% for Arts Providers, 45% for Arts Dollars, and 10% for Government Support. These weighted metrics are then added to generate the Arts Vibrancy score for a particular community. Arts Vibrancy scores for all communities are then compared to determine Top Arts-Vibrant Communities and allow for the generation of percentile-like scores as shown on the Arts Vibrancy Map.