What are the Trends?
Tracking the Return on Investment for Fundraising
We found that the same dollar of fundraising expenses actually brought in lower total contributed revenue over time.
Overall, Return on Fundraising expenses was on a slightly downward trajectory from 2014 to 2017, despite a small spike in 2016. This means that the same dollar spent towards fundraising expenses brought in lower total contributed revenue over time. After investigated, the small peak in 2016 further, we found that it was not driven by an outlier, as might have been assumed, but by a coupling of the highest average contributed revenue with the lowest average fundraising expenses during the 4-year period. It is important to note that this index examines all contributed revenue, not just the portion of overall contributions that are unrestricted.

- Organizations are spending less on fundraising, and the returns generated per dollar spent on fundraising are lower.
- Total fundraising expenses decreased by 3.3% while total contributed revenue fell by 5.9% from 2014 to 2017, after adjusting for inflation.
- Organizations spent more over time on fundraising personnel and far less over time on non-personnel fundraising expenses. Development compensation expense growth exceeded overall fundraising expense growth. The average organization shifted from allocating 54.4% of fundraising expenses to staff to an allocation of 62.4%, with the percentage increasing annually. The old saying in fundraising is that people give to people, so it makes sense to invest in personnel for successful relationship cultivation and development.
How Fundraising Performed Across 11 Arts Sectors
Breaking down trends by sector
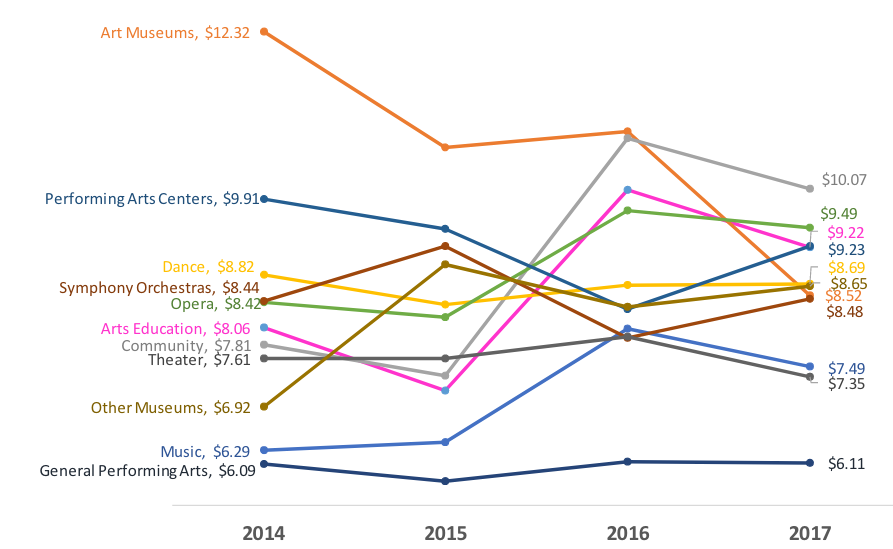
While the overall Return on Fundraising decreased over time, the majority of the 11 sectors actually saw an increase in return on fundraising by 2017. The only four to see a decrease in Return on Fundraising were the Art Museum, Dance, Performing Arts Center, and Theater sectors.
- The pattern of a slight 2016 spike and 2017 decrease in the Overall average was felt by organizations in the Community-based, Arts Education, Music, Opera, Theater, and General Performing Arts sectors.
- After adjusting for inflation, the sector with the highest growth over the span of four years was Community-based organizations at 28.8%, followed by Other Museums.
- Most sectors experienced volatility in terms of their Return on Fundraising over the four years.
- The Art Museum sector experienced the greatest overall decline in this index over time at -30.9%. One organization skewed the average high for the sector in 2014 and 2015. However, eliminating this organization from the analyses would still leave Return on Fundraising 20% lower in 2017 than in 2014 for remaining Art Museums.
- General Performing Arts organizations consistently had the lowest Return on Fundraising throughout all four years.
Comparing Small, Medium, and Large Organizations
Breaking down trends by size
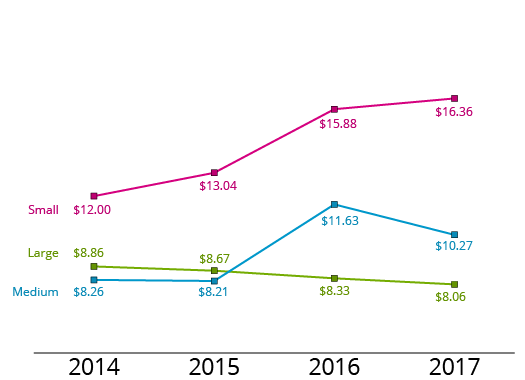
The average total contributed revenue and fundraising expenses decreased for organizations of every size from 2014 to 2017, mirroring the Overall Trend. Large organizations saw the largest decrease in total contributed revenue at -20.6%, while small organizations had the largest decrease in fundraising expenses at -28.0%.
- Small organizations tend to achieve a higher Return on Fundraising than Medium or Large organizations. Small organizations tend to be far more reliant on volunteer labor than their larger counterparts.
- Small size organizations became increasingly effective in their fundraising efforts. Their Return on Fundraising rose steadily from 2014 to 2017, with the greatest jump from 2015 to 2016.
- Medium organizations boosted their Return on Fundraising over time. The 2016 spike is due to one organization’s exceptional contributed revenue that year. Eliminating this organization from the analyses would leave 2016 Return on Fundraising at $10.04 for remaining Medium organizations, and 2017 at $10.11.
- Larger organizations had a steady decline in Return on fundraising over the four years from 2014 to 2017.
 Small and Medium organizations’ return on fundraising rose over time – they became increasingly effective and efficient. The opposite was true for large organizations.
How the Return on Fundraising Varied Across Markets
Breaking down trends by geography
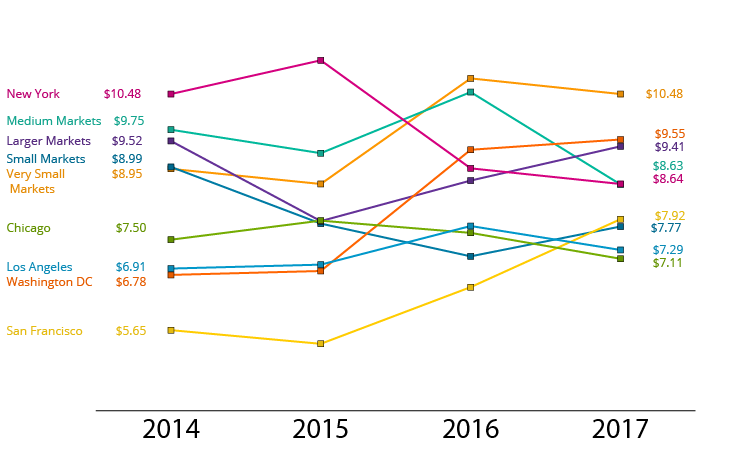
Organizations in all markets except Washington DC, San Francisco, Los Angeles, and Very Small Markets generated lower Return on Fundraising in 2017 than in 2014. In Washington DC and San Francisco, decreased levels of fundraising expenses generated higher contributed revenue. In Los Angeles and Very Small Markets, both fundraising expenses and contributed revenue increased, and the additional fundraising spend resulted in accelerated growth in contributed revenue.
- There was greater spread in Return on Fundraising among markets in 2014 and 2015, which narrowed in both 2016 and 2017 as San Francisco’s organizations become more effective in this area.
- The Washington, DC market saw the biggest growth in Return on Fundraising over the four years at 40.9% when adjusted for inflation. This is mostly due to a large increase in total contributed revenue which rose 30.9% from 2014 to 2017.
-
Average total contributed revenue was higher over time in Los Angeles, San Francisco, DC-VA, and Very Small Markets while it dropped in all other markets.