- DataArts News


(Re)Defining Success and Moving Forward Using KIPIs
- Posted Aug 24, 2021
As doors closed across the U.S. due to stay-at-home measures, the nonprofit arts and cultural sector entered into the world of digital offerings in ways it had never done before, which also marked an important shift in data collection and analysis moving forward.

After over a year of managing a massive, unexpected shift in the arts and culture landscape, it seems that there is a light at the end of the tunnel. As arts leaders, you’ve likely made creative and bold decisions at a breakneck pace to keep your organizations operating throughout this time, from building new digital revenue streams and new partnerships to having serious conversations about the future of your organization and about action toward true racial equity. Now that US Arts and Cultural organizations see a future where curtains may go up again, and soon, it's important to pause -- to take stock of changes you made, how you define (or redefine) success, how to use data to measure that success, and your hopes for moving forward.
As part of a graduate internship with SMU DataArts, I interviewed seven organizations of various sizes, sectors, and locations to discuss their experiences with the Key Intangible Performance Indicator (KIPI) Dashboard. During the same time, Julia was a graduate researcher for the Brierly Institute of Customer Engagement at the SMU Cox School of Business studying digital customer engagement practices during COVID-19. Together, our work consists of a total of ten interviews with arts organization leaders. This post describes the trends that emerged across our projects regarding digital innovation during, and after the COVID-19 pandemic.
Although COVID-19 has been an undeniable dark cloud, all of the organizations we spoke to reported silver linings. In assessing their programming and business models, organizations reported the importance of a healthy pool of working capital, which allowed more freedom to be strategic about government aid and production. Of course, one of the biggest considerations for arts organizations was how to address the temporary halt of in-person programming and audience engagement. Organizations had to decide whether to move online, and if so, to what extent. There was no “one size fits all” answer that we heard from these arts organizations; much depended on the history of the organization, available funding to pay for infrastructural change, and a prediction of whether the audience might eventually prefer a digital option post-pandemic.
Each organization interviewed pivoted to provide some level of digital offering. These offerings covered a wide spectrum of programming including, after-school programming, artist salons, creative learning courses and a fully virtual production. No approach was necessarily better than the other, but the different methods of engagement did seem to have different costs (both in employee time and financial effort) and benefits (measured in audience engagement, both during and after the pandemic).
For example, the spectrum may have looked something like this:
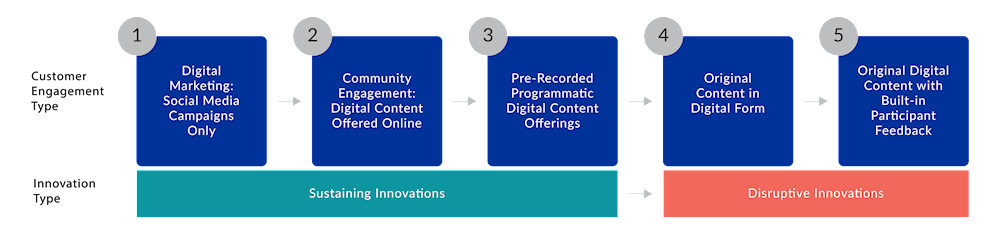
As a result of transitioning to digital offerings, there was increased audience participation and reach, important technological updates to current systems, and sometimes even new income streams. One organization cited their ability to serve youth that are normally outside of their “pick-up parameter” by moving their after-school programming online. Another organization described a virtual field trip that saw 100 times the attendance compared to its in-person field trip. For another organization, rethinking program delivery led to a new income stream from licensing fees, an important tweak to the organization’s business model.
When asked what would stay, almost all the interviewees expressed intention to keep some form of digital programming, but mostly in the supplementary (sustaining) programming areas. For most organizations we heard from, the main goal was to keep the momentum moving forward enough to draw audiences back in their original formats. Leaders of most organizations, but especially arts and culture, will almost always experience a challenging push-and-pull between resources and time. Overall, we found that there is intention to keep some form of digital programming, prompted mostly by the increased reach and accessibility it offers to patrons or beneficiaries. However, now is the chance to be strategic when making decisions about which digital innovation to permanently add to your organization’s repertoire. We recommend using your mission as the compass, thinking about which digital offerings truly contribute to your goals and the needs of your audience. If adapted current programs or newly created content play a part in delivering on your mission, you must decide if it is possible to keep that program available, and how.
So far, we have primarily discussed change. However, some facets of an organization’s management will stay constant. SMU DataArts’ KIPI dashboard presents indicators that fall into nine categories, five of which are centered around revenues, expenses, and financial statement-focused metrics. Through an assessment of indicator-utility trends and conversations, it became clear that financial KIPIs were the most frequently referenced. Specifically, “contributed revenue,” “earned revenue,” “expenses,” and “balance sheet.” This tells us that the practice of budget assessment and the constant push for financial sustainability will remain an integral part of leading a successful organization.
SMU DataArts’ tools like the KIPI Dashboard can aid in your decisions about where to focus time and resources going forward. Use the KIPI Dashboard to assess your current financial and operational health, remembering to choose a few important metrics for your organization to focus on. Once you have chosen which indicators are important to your organization, you can continue to re-enter your data on a yearly basis and measure changes in your scores over time. For example, if your organization made programming changes this year, you can assess the effect on engagement by looking at the People per Offering KIPI, under Program Activity. The People per Offering KIPI shows your organization’s relative performance of engagement by measuring the ratio of total number of people engaged with your organization’s total offerings. For more constant management questions, determine what specific financial or operating areas your organization is working to improve. For example, if increasing earned revenue is your goal now that in-person programming is becoming an option, then you can utilize one of the earned revenue indicators like Program Revenue per Attendee to track program revenue earned per person based on in-person attendance. Alternatively, if your organization is doing consistently well at managing expenses, use the expense indicators to confirm that your performance is staying steady relative to other organizations. Whether your innovations are intended to be sustaining, disruptive, online, in-person, or somewhere in-between, we hope that you’ll use your mission statement and data to ensure the best outcomes for your organization.