What are the Trends?
Tracking How Unrestricted Contributions Covered Expenses
Contributed revenue decreased, while expenses rose. Seven out of the total eleven sectors saw growth in unrestricted contributed revenue that lagged behind inflation.
Relative to expenses, unrestricted contributed revenue was lower in 2017 than in 2014. It decreased steadily from 2014 to 2016 and then it rose by nearly 3% from 2016 to 2017.

Unrestricted Contributions Covered Less Expenses in 2017 than in 2014 for all sectors except Music, Opera, and General Performing Arts
Breaking down trends by sector
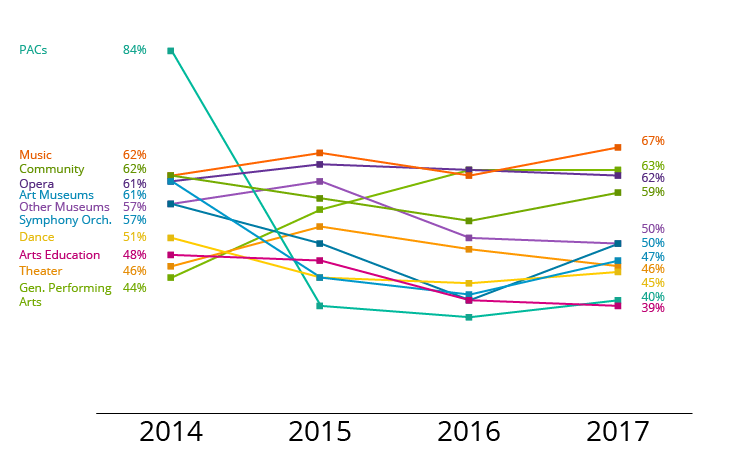
A majority of the sectors experienced volatility in their unrestricted contributed revenue relative to their total expenses from 2014- 2017. Art Museums, Community, Dance, Performing Arts Centers and Symphony Orchestras saw a drop in this index in 2015 and 2016, followed by a slight recovery in 2017.
- The contributed revenue index for Arts education organizations steadily declined over the span of four years whereas the reverse was true for General Performing Arts.
- The magnitude of the Art Museum sector’s trend was skewed by an outlier. Eliminating this organization would leave the index roughly 15% higher each year for remaining Art Museums, but following the same pattern of decline from 2014 to 2016 with an uptick in 2017.
- The trend for the Performing Arts Center sector was driven by an outlier. Eliminating this organization from the analyses would leave the index annually in the 32% to 34% range for remaining PACs.
 Only 3 sectors, Art Museum, Symphony Orchestra and General Performing Arts, out of the 11 had lower total expenses in 2017 than in 2014 after adjusting for inflation. For Art Museum and Symphony Orchestra sectors, the drop in unrestricted contributed revenue was greater than that of expenses, driving down their index levels.
Small Organizations Cover More of Their Budget with Contributed Revenue Than Medium and Large Organizations
Breaking down trends by size
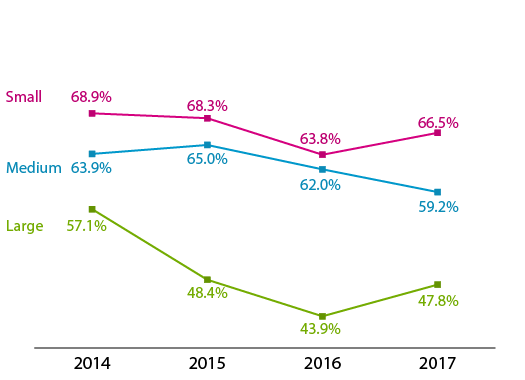
Small organizations tend to cover more of their budgets with unrestricted contributed revenue than medium or large organizations. Both, small and large organizations had a dip in their unrestricted contributed revenue index in 2015 and 2016, but then had a rise in 2017, a pattern that repeats the finding for the Overall trend. For Small organizations, the increase in index level in 2017 was primarily due to the increase in unrestricted contributed revenue while for Large organizations, the increase in 2017 was due to the decrease in total expenses.
- The exaggerated drop in the index for Large organizations was primarily skewed by a large Art Museum and a large PAC, as mentioned in the observations about trends by sector.
- Small and Large organizations had their lowest unrestricted contributed revenue index level in 2016 while Medium organizations had their lowest in 2017. Small organizations hit the lowest index level in 2016 because of the fall in unrestricted contributed revenue while Large organizations hit the bottom because of increased total expenses.
- Because organizations change budget size over time, there are slight variations in the set of organizations in each size category from year to year.
Comparing Growth in Markets Across the Country
Trends across geography
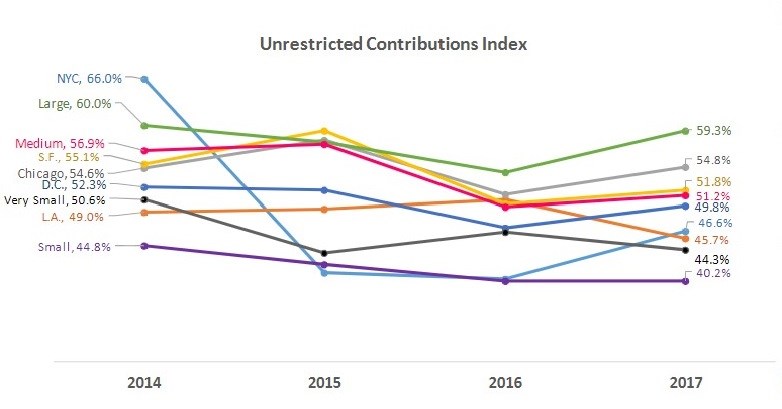
- The average organization in Large markets, Medium markets, San Francisco, and Chicago consistently covered more than half of its expenses with unrestricted contributions.
- Organizations in Los Angeles as well as those in Small and Very Small markets tend to cover less of their budgets with unrestricted contributions than organizations in other markets annually.
- Seven of the nine market clusters hit their lowest 4-year index level in 2016 and recovered somewhat in 2017. The exceptions to this trend are LA organizations and those in Very Small Markets who had the rise in index level in 2016 and then fall in 2017.