Theatres at the Crossroads: Overcoming Downtrends & Protecting Your Organization Through Future Downturns
by Zannie Voss, Manuel Lasaga, and Teresa Eyring
While the U.S. economy has been and is currently in a period of expansion, there are signs that it is slowing in 2019. Investors in the bond markets, which recently pushed the yields on the 10-year Treasury bond below 2%, are expecting an imminent recession, while investors in the stock market, which has recently set new highs, are upbeat, expecting continued growth in companies’ cash flows.
Will the U.S., and more specifically the theatre field, soon experience a new period of financial turbulence? Are theatres prepared to overcome the downtrends in their net revenues? How prepared is the field to weather an economic storm or a secular downtrend in their capital reserves? How will the economic environment affect attendance and philanthropy? These are the questions we explored during the first part of a two-part skills-building session titled The Long View: Data-Informed Decision-Making About Your Financial Future at Theatre Communications Group’s 2019 National Conference in Miami. This paper is an outgrowth of that session.
Analysis of past performance provides valuable insights about how things may happen in the future; however, the future also brings new factors, events, and problems that may not have been present in the past. Each business cycle is unique. Nevertheless, we can identify long-term trends from the past that are reasonably expected to continue into the future – both opportunities and challenges – as well as certain cause-and-effect patterns of how a cyclical downturn affects performance.
As was the case for most sectors of the economy, the recession of 2007 to 2009 – the so-called Great Recession – had a temporarily negative impact on many areas of theatres’ finances and operations including individual and trustee contributions, single ticket income, endowment earnings, capital gains, and foundation support. Each of these areas recovered fully in post-recession years along with household net worth, financial markets, and the rest of the economy.
Nevertheless, the persistent downtrend in some areas of finances and operations also raises questions about theatres’ strategies and the business models they are utilizing to implement those strategies. Theatres’ greatest areas of vulnerability are subscriptions, overall attendance, corporate contributions, and working capital, each of which suffered in the crisis and has yet to return to pre-recession levels. Their decline occurred alongside double-digit growth in every area of expense. These areas put theatres’ sustainability at risk if they are not addressed before another period of economic decline. Low working capital levels mean that theatres do not have liquid resources to cover negative bottom lines like those seen in the last recession. Were another recession to precipitate similar trends, the future would undoubtedly see more instances of financial distress, including the possibility of insolvency and closure for some organizations.
In this paper we first explore the U.S. economic and financial outlook to better understand the environment and its risks. Then we follow trends for theatres’ finances and operations, starting with the years prior to the last recession, to identify key trends in the not-for-profit resident theatre industry. We conclude with recommendations of steps to take for recession preparedness given the identified vulnerabilities.
U.S. Economic and Financial Outlook
In July 2019, the U.S. economic expansion became the longest in recorded history. If indeed all good things must end, it is reasonable to question how long the current expansion can last.
Peaks and troughs define historic U.S. business cycles. The National Bureau of Economic Research defines a recession as “a significant decline in economic activity spread across the economy, lasting more than a few months, normally visible in real GDP, real income, employment, industrial production, and wholesale-retail sales.”[1] The Great Recession began at the peak of a U.S. business cycle in December 2007 and ended at its trough in June 2009. Its duration was exceptional; at 18 months, it was the longest since World War II.[2]
We are in a Goldilocks economy. Consumer demand is healthy. There is growth in household income, little inflation, record-low interest rates, and a low unemployment rate signals full-employment production. Individual household net worth increased 6.1% annually on average from 2010 through 2018, and consumer credit as a percentage of disposable income has been on an upward march since 2010, indicating robust demand for goods and services that keeps money circulating in the system. Global growth has been better than expected, with China leading the charge, although at a slower but sustainable pace. In recent years, businesses expanded their investment spending to keep up with market expansion and technological advancements: production of machinery and equipment was up 5.4% in 2018 and computer and electronic products rose 5.3%. Investment in technology improves productivity, which boosts economic growth and lowers unit labor costs.
No one has a crystal ball to see the end date of the current expansion. Many economists predict that the next recession will occur between now and 2021, although it is expected to be mild unless the downturn is felt globally. Recent U.S. GDP growth has been in the sweet spot of between 2% and 3%: 2.9% GDP growth in 2018 followed by an anticipated 2.4% in 2019. However, the slowdown in 2019 is expected to continue into 2020 and 2021 as a result of the ongoing trade disputes with China and Europe, which have consequences not only for global influence but also for long-term economic policies related to trade, tariffs, technology, and productivity.
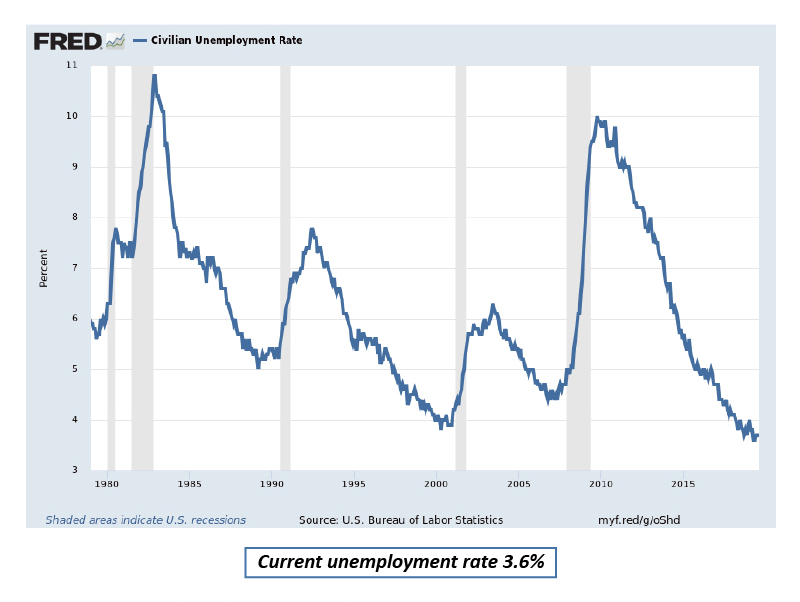
Inflation has been rising but only moderately. The 2018 year-end 12-month inflation rate was 1.9%. It is expected to rise to 2.7% in 2019 followed by 2.3% in 2020. Recent inflation trends are driven by oil prices, unemployment, productivity and unit labor costs (ULC), capacity utilization, and tariffs. Oil prices have been trending up with usual volatility and unemployment is at a record low (see Figure A), which puts upward pressure on wages. The increase in trade tariffs is expected to have a moderate impact on inflation, which should be more noticeable during the second half of this year.[3] On a positive note, following a period of slow productivity growth since 2012, which contributed to higher ULC, business capital expenditure growth during the expansion led to a pickup in productivity in 2018 that has continued into 2019. The euro’s value has trended down with respect to the U.S. dollar since reaching a peak in 2008, which is another inflation-dampening factor. These trends represent good news.
Figure A: Civilian Unemployment Rate
Yet there are significant risks on the horizon. Further escalation of the current trade conflict between the U.S. and China, the two dominant economies of the world, could have negative, long-term consequences for inflation and global economic growth. Moreover, the trade disputes are eroding confidence, creating uncertainty and fanning investors’ fears of a trade war. Additionally, there is wariness over the potential economic consequences of a no-deal Brexit. Financial markets tend to respond poorly to uncertainty, thus increasing the risk of a recession.
Although there is a high degree of uncertainty about the long-term economic effects of climate change and how they might play out, recent events demonstrate that the rise in average temperatures and sea levels can create adverse economic impact. For example, in 2019, fires in California resulted in significant property and infrastructure damage while severe flooding in the U.S. Midwest meant the loss of crops and livestock, particularly in Iowa and Nebraska. These developments need close monitoring.
The fiscal health of the federal government continues to deteriorate. Another area of concern is the impact of tax reform and its consequences for a downgrade of the U.S. debt rating. The tax reform law known as the Tax Cuts and Jobs Act of 2017 notably reduced the corporate tax rate from 34% to 21% in an effort to incentivize business capital expenditures that would eventually create jobs, but it also reduces tax revenue. This reform comes at a time of very large increases in government expenditures, particularly spending by Social Security, Medicare, interest on our federal debt, defense, and infrastructure. The new budget deal negotiated by a sharply divided Congress and signed by the president on August 2 of this year significantly increases the probability of a federal debt downgrade by one of the rating agencies as early as 2019. The new budget deal has one major flaw: It suspends the debt ceiling until the end of July 2021, thus allowing significant spending increases in what will be a hotly contested electoral year in 2020. The federal deficit is expected to reach about 4.6% this fiscal year and higher deficits are forecasted by the Congressional Budget Office (CBO). The CBO estimated in May 2019 that the federal debt will reach an unprecedented 93% of GDP by 2029. It appears that when it comes to the federal debt, the sky is the limit.
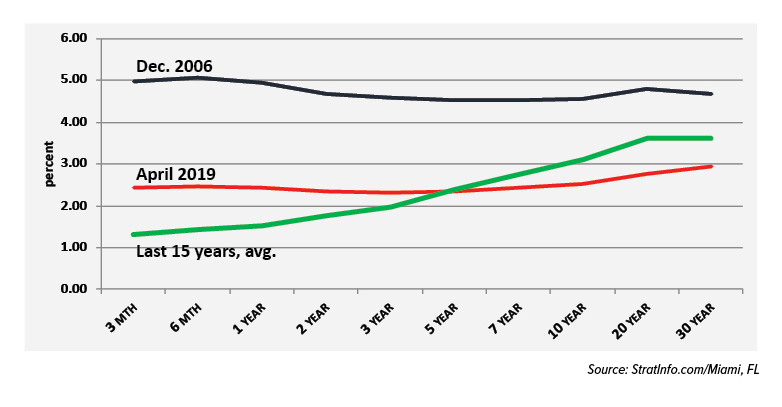
With the surge in federal deficits, it is surprising that the rating agencies have yet to reassess their outlook for the financial health of the federal government. These imbalances are likely to result in a downgrading by the rating agencies before the end of this year, and high levels of debt make investors less willing to finance the government’s borrowing unless they receive higher interest rates. Not only does this raise the government’s debt burden even further, it gives investors pause about the risk inherent in the near-term economy. That is why there is anxiety surrounding the partial inversion in U.S. bond yields. Long-term bonds typically yield more than short-term bonds. However, the yield curve has inverted, with 10-year bonds yielding less than short-term bonds. A yield curve inversion has in the past acted as an early sign of economic vulnerability prior to the onslaught of a recession; however, with moderate inflation, low interest rates, some production capacity in manufacturing, and continued growth in consumer spending, the current yield inversion does not fit the mold of a recession trigger. In this regard, the past behavior of the yield curve may not be a reliable predictor of future events facing the U.S. economy (see Figure B).
Figure B: Treasury Yield Curve
The Long View: 2004-2017, What Past Experience Tells Us
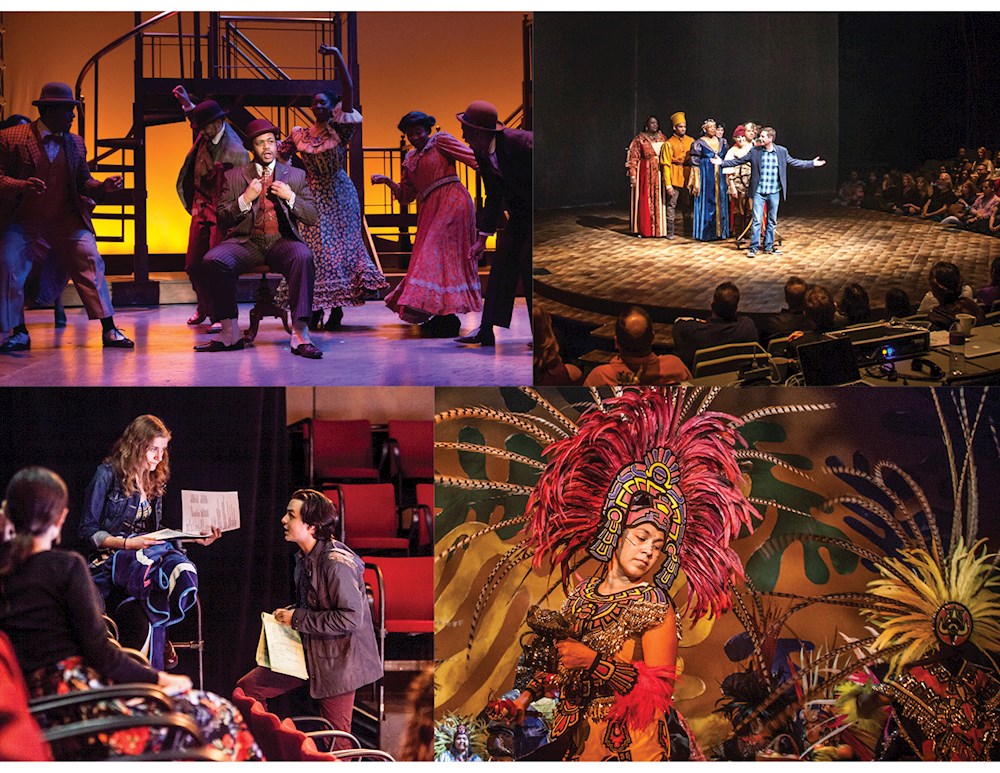
We look to trends in the broader economic environment since they affect arts organizations. While the work they produce, present, or exhibit often transports people out of their day-to-day lives, the organizations themselves operate amidst the same day-to-day realities as any business. The highs and lows of the economy affect their health and stability. In this section, we examine how and to what extent.
We examined the experience of the last recession and the long-term trend during this sustained economic expansion to get a glimpse into theatres’ preparedness heading into that recession, to identify the operating areas most affected during it, and to view the various areas of subsequent growth and decline in order to identify long-term trends that point to both opportunities and challenges. To accomplish this, we followed a set of 75 U.S.-based not-for-profit professional theatres over the period 2004 to 2017. These “Trend Theatres” consistently participated in Theatre Communications Group’s annual Fiscal Survey, which serves as the basis for Theatre Facts, TCG’s annual report on the state of the U.S. professional not-for-profit theatre field, compiled in collaboration with SMU DataArts. While these theatres’ 2017 budgets ranged from $285,000 to $78M, it is important to recognize that some very large theatres skew the average: the mean 2017 total expenses were $11.1M while the median came in at $7.6M. As of the writing of this report, we do not have 2018 or 2019 data to provide an even more up-to-date view, but the 2017 end-point provides some relevant insights to share. All financial data shown in the Figures and mentioned in the text have been adjusted for inflation.[4]
The Great Recession had a negative effect on theatres just as it did on nearly every sector of society, particularly the huge drop in household wealth that resulted from the decline in financial and real estate markets. The strong economy that bolstered capital campaigns and operating income during the first four years of the 14-year trend analysis deteriorated in 2008 and continued its slide in 2009. Most areas of operations and finances recovered fully post- recession. Other areas have yet to recover to pre-recession levels, most notably attendance, subscriptions, corporate contributions, and working capital.
Growth in Expenses, Earned Income, & Contributed Income Soared Above Inflation from 2004 to 2017
During 2004 – 2017, expense growth outpaced revenue growth (i.e., earned and contributed income combined), thus worsening theatres’ financial performance by leaving the average bottom line 6% lower in 2017 than in 2004 (see Figure C). Every expense area’s growth exceeded inflation by double digits: production non-payroll expenses and administrative payroll increased most, artistic payroll and marketing least. The steady increase in expenses for the average organization reduces the value of existing liquidity, a topic that resurfaces in our discussion of working capital.
Figure C: Average Expenses, Earned Income, Contributed Income, and Change in Unrestricted Net Assets, 2004-2017*
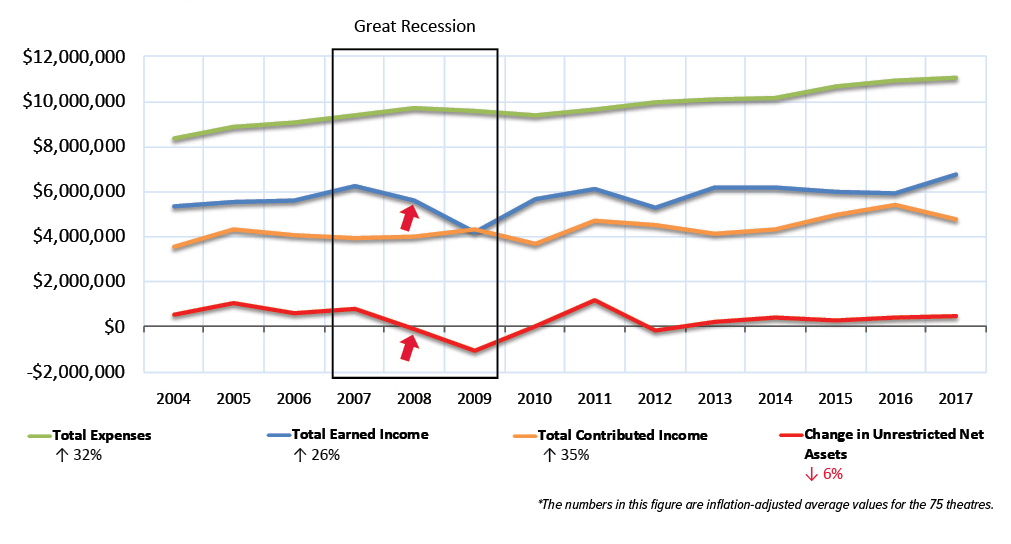
Earned income experienced a precipitous drop during the Great Recession while expenses and contributed income continued their upward trajectory. Belts were briefly tightened in 2009 and 2010, precipitated by two years of negative Change in Unrestricted Net Assets (CUNA) in 2008 and 2009. Job cuts affected full-time, part-time, and jobbed-in employees, putting added pressure on remaining employees. Employment figures began their recovery in 2011 and have been on the rise ever since. There was a delayed impact on contributed revenue, too, which dipped in 2010 but rebounded quickly.
In 2009, earned income was lower than it was in 2004 in nominal dollars, and the adjustment for inflation only exacerbated the decline. As shown in Figure D, this downward trend was largely driven by capital losses that mirrored the global economic decline in capital markets and affected households as well. However, the elimination of capital losses from the analyses would still leave a marked drop in earned income in 2009. This category of investment instrument income, which reflects gains or losses in the present market value of an investment portfolio (excluding endowment, shown separately) in addition to gains or losses from the sale of fixed assets or securities, tracks closely with highs and lows in the overall economy. Endowment earnings/transfers did not surpass pre-recession levels until 2017. In the early part of the period, roughly one-third of theatres were in an endowment or capital campaign each year. That percentage inched up over time and has steadied at nearly 50% since 2014.
Figure D shows that, overall, single ticket income and other earned income growth mainly drove the 14-year increase in earned income, while subscription income continued to decline steadily. Other earned income (from rentals, education/ outreach programs, concessions, co-productions, etc.) has now taken the mantle of subscription income in terms of expense support.
Figure D: Average Earned Income, by source, 2004-2017*
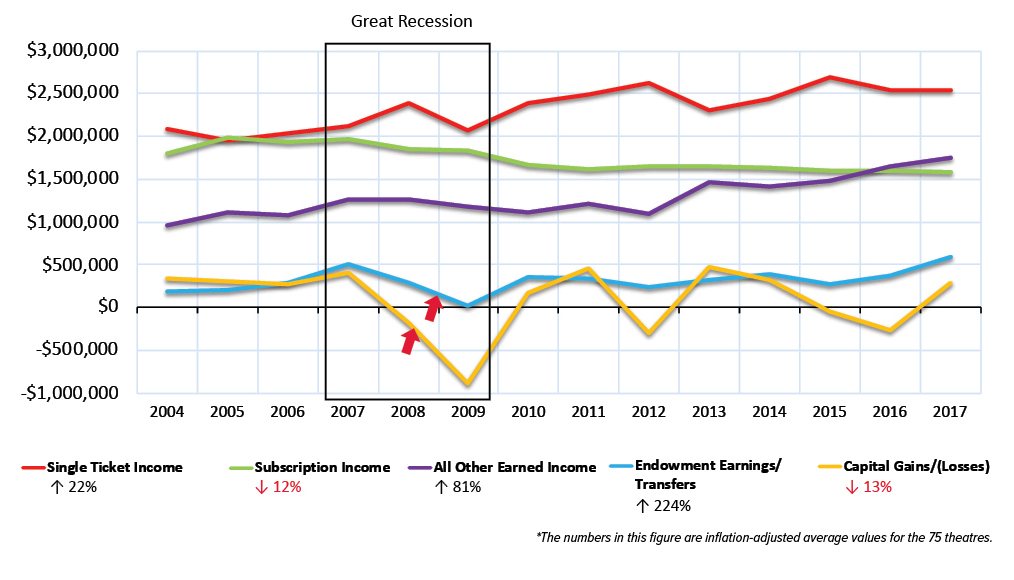
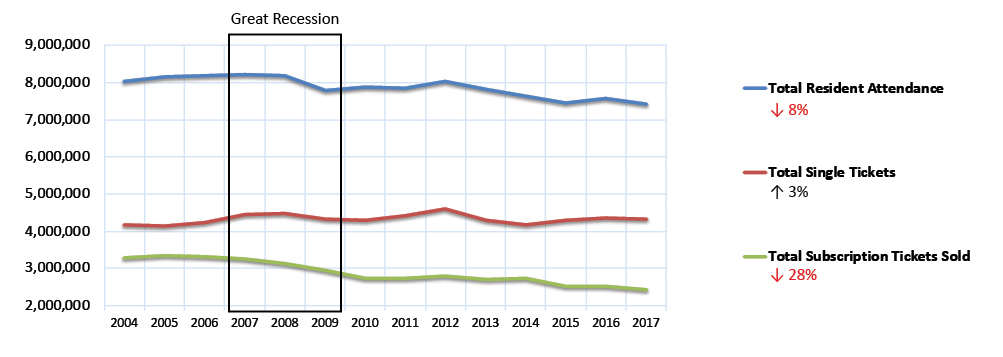
Closer examination reveals that slightly more single ticket buyers were charged higher prices over time while fewer subscribers/members were charged higher prices. More specifically, there were 3% more single ticket buyers in 2017 than in 2004 (see Figure E), while the average single ticket price rose 12% more than inflation. Single ticket income rose and fell during recession years but did not incur permanent scars (see Figure D). In fact, there were more single tickets sold annually during the recession than in the years leading up to it (see Figure E). By contrast, theatres sold 28% fewer subscription tickets during the 14-year period while the average price of a subscription ticket increased 15%. Subscription sales were at their highest of the 14-year period in 2005. They incurred a steep decline during the recession and have continued their downward slide since.
The loss of subscribers coupled with a very slight increase in single ticket buyers combined to produce an 8% decrease in total attendance at resident productions, as shown in Figure E. Total resident attendance (free and paid attendance for all resident offerings) for the 75 theatres was at its 14-year high of 8.2 million at the beginning of the recession in 2007. It took a hit towards the end of the recession in 2009 and has yet to recover to its pre-recession level. This attendance decline occurred despite the fact that the corresponding number of performances offered increased 4%.
Figure E: Aggregate Resident Attendance, Single Tickets Sold, and Subscription Tickets Sold, 2004-2017[5]
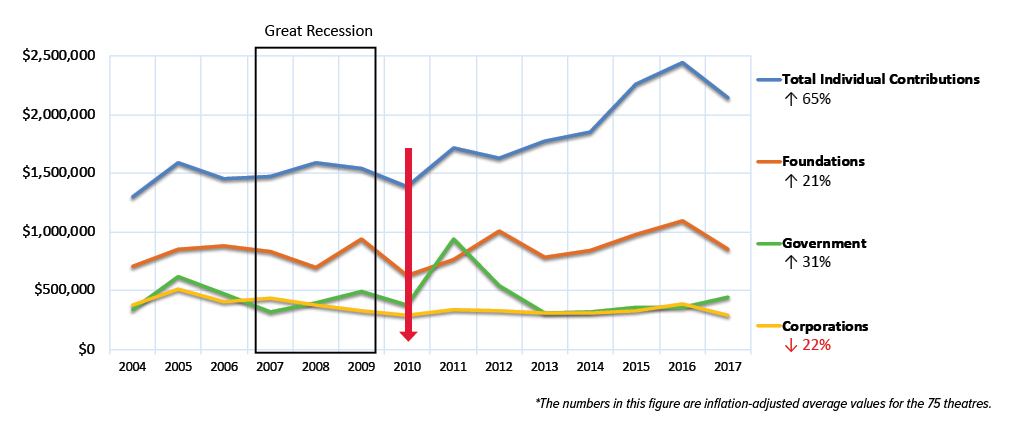
The long view shows resiliency and expansion of contributed support from all but corporations, as shown in Figure F.[6] Individuals provided more annual support than any other source of funds, and individual giving growth surpassed inflation by 65% from 2004 to 2017. The impact of the Tax Cuts and Jobs Act of 2017, which took effect in 2018 and increased the standard deduction while also eliminating the charitable deduction for non-itemizers, is expected to have a negative impact on individual contributions moving forward. Trustees provided 78% more support over time. Non-trustee donors gave 57% more in contributed funds, but these donations came from 9% fewer individuals.
The increase in government funding came from a doubling of local funds and 17% growth in state arts funding, while average federal arts funding awarded to the Trend Theatres diminished by half over time. Three theatres’ exceptional city/county unrestricted support of capital campaigns drove the 2011 spike in government funding.[7] Generally speaking, the percentage of unrestricted contributions earmarked for capital campaigns ebbed and flowed with no clear pattern.
The 2010 dip in contributed income was pervasive across contributed income sources, as shown in Figure F. The lag effect can be attributed to foundations, corporations, individuals, and government agencies encountering their own losses during the recession, responding with a round of belt-tightening, and finding themselves subsequently with less support available for theatres, particularly when most foundations use 12-quarter trailing averages to establish their annual giving budgets. The recession left no permanent scars on contributed income except in the area of corporate giving, which has never returned to pre-recession levels. It is the one area of philanthropy where either interests were permanently diverted to other nonprofit causes or overall giving levels simply never recovered.
Figure F: Average Contributed Income, by source, 2004-2017*
Over time, the net effect of expense growth in excess of total income growth has been a general increase in the percentage of theatres incurring negative Change in Unrestricted Net Assets (CUNA), the bottom line (see Figure G). Namely, fewer theatres ran a deficit in 2006 and 2007 than in the years since. Nevertheless, more than half of the theatres had break-even or positive bottom lines in all but three years: 2009, 2012, and 2016.
Figure G: Annual percentage of theatres with negative versus positive CUNA, 2004-2017
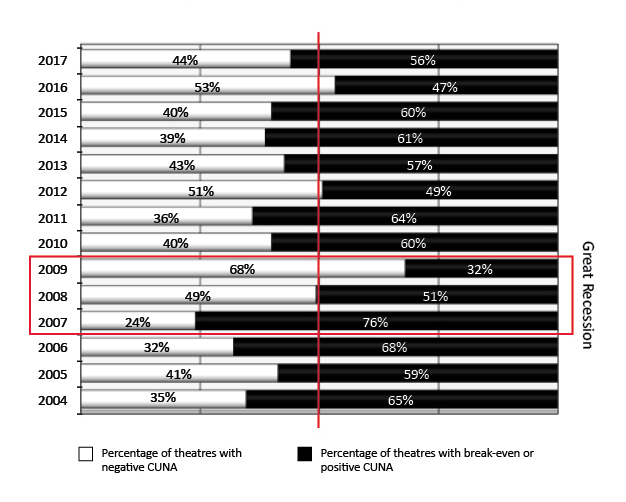
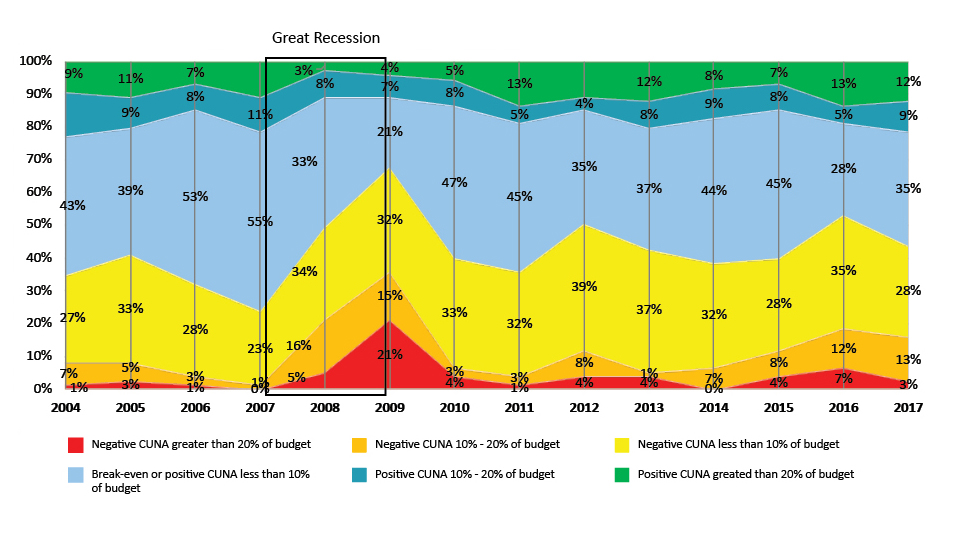
For most theatres, bottom lines deteriorated along with the economy during the recession (see Figure G). But to what extent? As Figure H shows, deficits were at their most severe in 2009. Nearly a quarter of the theatres had a deficit in excess of 20% of total annual expenses in 2009 (the red shaded area in Figure H) and another 15% had negative CUNA equivalent to 10%-20% of the budget (the orange shaded area). While capital gains and losses were not solely responsible for the highs and lows represented in Figure H, they were a significant contributing factor (see Figure D). This underscores the sensitivity of theatres’ financial performance to changes in financial markets. It is interesting to note that deficits were at their second greatest of the 14-year period in 2016: more theatres had a negative rather than positive bottom line, and deficits exceeded 10% of total expenses for nearly 20% of theatres.
Figure H: Recession focus on the extent of deficits and surpluses over time (% of theatres in each category)
There Was Tremendous Asset Growth, but Not of the Liquid Kind
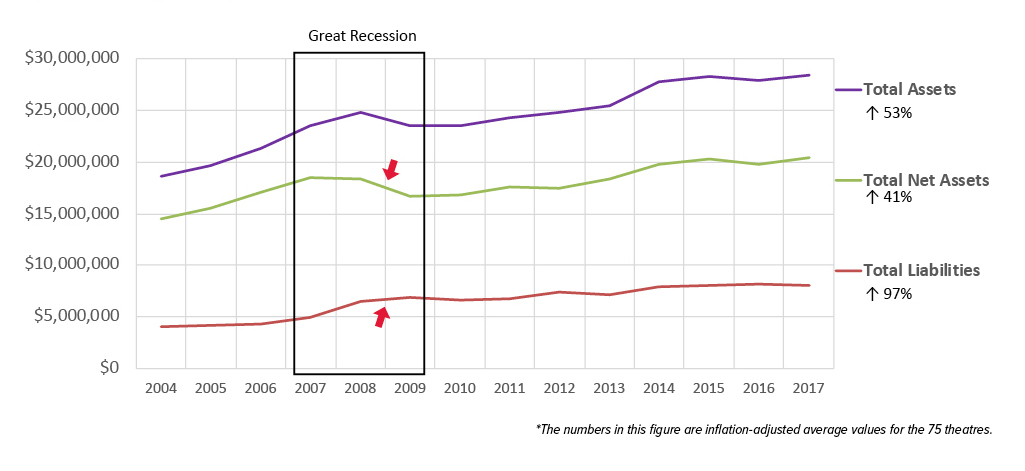
There was tremendous growth in theatres’ assets, which increased 53% in excess of inflation over the 14-year period (see Figure I). The recession precipitated a drop in the value of net assets and an upswing in that of liabilities. Both have risen annually since, but at different rates. Total net assets represented 78% of total assets in 2004 but only 71% in 2017, underscoring the growth in liabilities as a proportion of assets over the period. In other words, theatres took on more debt and other obligations during the recession and also used debt to finance growth in assets coming out of the recession, more than they did pre-recession.
Figure I: Average Assets, Net Assets and Liabilities, 2004-2017*
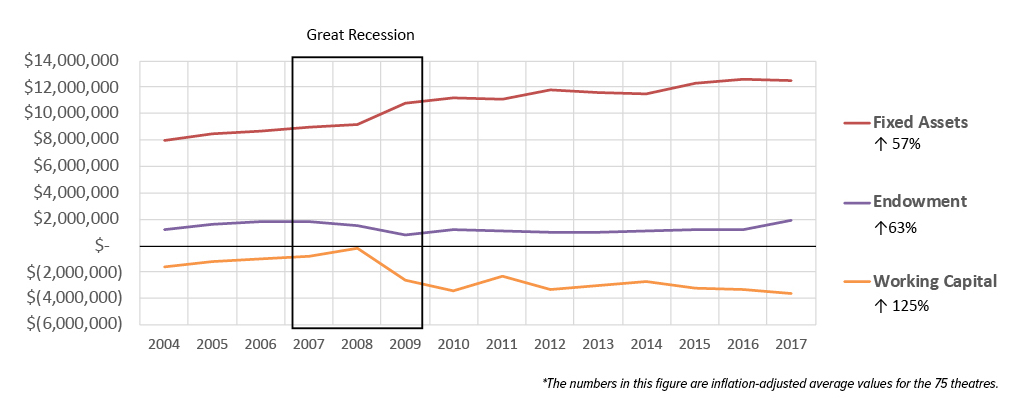
In Figure J, we show trends in the composition of net assets that are unrestricted, which includes fixed assets as well as unrestricted cash and investments. This category of net assets merits attention because it represents an organization’s net worth that is available to tap at the organization’s discretion since it is not earmarked for restricted purposes. The recession did not deter growth in average unrestricted fixed assets, which increased 57% over time. Unrestricted, board-designated quasi-endowment values were at their lowest in 2009 and their highest in 2017, reflecting the recovery in financial markets.
The liquid portion of unrestricted net assets is working capital. Sufficient working capital allows an organization to cover short-term obligations to employees, vendors, and banks. With it, an organization can navigate unpredictable shortfalls in revenue, such as might occur during an economic downturn. When working capital is negative, it means that the organization is likely borrowing funds to meet day-to-day cash needs and current obligations, either internally (e.g., from deferred subscription income or cash from multiyear grants) or from external sources such as lines of credit.
One of the more stark and lasting trends since the recession is the toll taken on working capital. Working capital was negative every year, and negative working capital was the reality for roughly two-thirds of the theatres annually. It was at its best in 2008 when it nearly penetrated the surface into positive territory. Overall, however, working capital has been on a downward march since the recession, becoming 125% more negative in 2017 than it was in 2004. Expense growth, at 32% during the same period, made matters worse by reducing the value of existing liquidity: Not only was there less liquidity, but there was also greater need for resources to support the payment of both ongoing and one- time expenses. Worsening negative working capital is a major cause for concern and a threat to the field’s future viability. Theatres added infrastructure but now have little financial flexibility should they face another economic downturn.
Figure J: Average Unrestricted Net Assets, by type, 2004-2007*
If recent trends continue, another recession in the future could seriously undermine theatres’ working capital buffer against losses. Another period of accelerated subscription declines could create a seriously diminished overall attendance base if theatres are unable to offset the drop with a surge in single ticket buyers. Debt levels could rise to unsustainable levels. In addition to compromising their artistry and ability to fulfill their missions overall, organizations run the risk of insolvency and collapse if they are unable to generate sufficient cash from their operations to cover obligations over long periods.
Conclusion
The economic expansion continues, now on its 11th year, but at a more moderate pace. Yet this is not a moment for complacency, as we may face a slowdown in the coming two years. We know that attendance overall declined during the Great Recession and has not returned to prerecession levels, with the loss of subscribers propelling the decline, a worrisome trend for theatres. Expenses have exceeded inflation in the double digits, and increasingly, single ticket sales, individual contributions, and other earned income are filling the gap. Still, bottom lines are 6% less positive and working capital is steadily declining to levels comparable to the last recession.
These trends reflect the history of 75 theatres, which may or may not be representative of all performing arts organizations’ experiences during the Great Recession and subsequent years. Awareness of these patterns and trends should, at the very least, encourage executive and artistic leaders and their boards to assess their current strategies by reviewing the impact that the last recession had on their own organization’s performance and analyzing carefully how they have fared since in areas such as earned income, expense growth, and working capital. Planning and preparedness can help arts leaders to avoid crisis mode in the event a recession does occur and, equally important, to navigate through longer-term changes that are affecting their financial performance.
We offer this food for thought |
- It is an excellent time to reduce debt and build working capital[8]. In the event of a recession, strong working capital will help ease the cash flow crunch should earned revenue decrease.
- Prepare for a potential downturn with a back-up plan, and look beyond the short-term. It may be a good time to cultivate an exciting, mission-aligned project for a future year while the economy is still strong – one that will reinvigorate your artists, staff, audience, and donors.
- Stem the ebb tide of individual engagement. Focus on audience retention strategies and deepening relationships with individual donors, the giving source of highest growth post-recession. The investment in personal relationships and development of loyalty will be particularly important if the Tax Cuts and Jobs Act of 2017 discourages mid-level donors from continuing their annual philanthropy.
- Examine single ticket marketing plans and pricing, as well as the relationship between subscription declines and pricing. Some organizations are finding success with smaller ticket packages, thematically oriented and priced appropriately. Opportunities offered through strategic social media and online marketing allow theatres to reach and engage audiences at a much lower cost than a decade ago. Make sure your plans are up to date and that you are tracking analytics in order to make the best decisions.
- Evaluate and, if possible, reduce expenses while taking care not to compromise in areas that are central to your mission and purpose, such as the artistry itself and the ability to draw people to As Michael Kaiser purports in The Art of the Turnaround to be his mantra for running successful organizations, “Good art, well marketed.”[9]
- Engage your staff and board in financial scenario planning. Test options and forecast when and how you will respond if the economy declines.
- Engage with your peers to share solutions, lessons learned, and possible collaborative opportunities.
Theatres that are in a vulnerable position in the best of times will be at serious risk of failure when the current expansion business cycle ends. It is worth taking time now to safeguard your stability and vitality for the future, and to find the growth initiative for your organization that will drive your sustainable long-term success.
About the Authors
Zannie Voss is Director of SMU DataArts, the National Center for Arts Research, and Professor of Arts Management in SMU’s Meadows School of the Arts and the Cox School of Business. Previously she was Chair of Arts Management at SMU, a Professor at Duke University and Producing Director of Theater Previews at Duke, and Managing Director of PlayMakers Repertory. She has co-authored Theatre Facts for Theatre Communications Group since 1998. Her published research on the strategic factors that influence organizational performance appears in over a dozen academic and practitioner journals. She serves on the boards of the International Association of Arts and Cultural Management, TRG Arts, the New Orleans Museum of Art, and TACA. She also serves on the American Academy of Arts and Science’s Commission on the Arts and is co-author of the book Outrageous Fortune: The Life and Times of the New American Play. She has a Ph.D. in Management from IAE Aix Graduate School of Management – Aix-Marseille University.
Manuel Lasaga is President of Strategic Information Analysis, Inc. (StratInfo), an economics and finance consulting firm established in 1993 in Miami, Florida, and Clinical Professor in the Finance Department at the College of Business, FIU, Miami, Florida.
He has more than 30 years of experience advising entrepreneurs, multinational corporations, financial institutions, government agencies, and professional services firms. Lasaga is also an advisor to banks in strategic planning, asset/ liability management, credit risk, and management evaluations. Lasaga has held high-level positions with Wharton Econometrics in Philadelphia; Citibank in New York; and Southeast Bank in Miami. He has consulted for 25 years with the World Bank in Washington, D.C., in the evaluation of capital markets and development projects in emerging markets.
He has served for 25 years on the Board of Directors of Baptist Hospital of Miami, and is also on the Board of the Miami Cardiac & Vascular Institute Management Company. Lasaga has a Ph.D. in Economics from the University of Pennsylvania.
Teresa Eyring is Executive Director and CEO of Theatre Communications Group (TCG), the national organization for theatre in the U.S. She guides an array of programs to strengthen, nurture, and promote the theatre field, including mentorship and knowledge-sharing, convenings, research, publishing, federal advocacy, grantmaking, and global cultural exchange. Prior to TCG, Eyring spent more than twenty years as an executive in theatres across the U.S., including managing director of the Children’s Theatre Company in Minneapolis and the Wilma Theater in Philadelphia; assistant executive director of the Guthrie Theater; and development director of the Woolly Mammoth Theatre Company in Washington, D.C. Eyring holds a B.A. in International Relations from Stanford University and an M.F.A. in Theatre Administration from Yale School of Drama. She serves on the boards of The Actors Fund, Performing Arts Alliance, Upper Manhattan Empowerment Zone, and on the advisory board of SMU DataArts. Since arriving at TCG, she’s passionately promoted a vision of “A better world for theatre, and a better world because of theatre”.
About SMU DataArts
SMU DataArts, the National Center for Arts Research, is a joint project of the Meadows School of the Arts and Cox School of Business at SMU that investigates important issues in arts management and patronage and makes its findings available free of charge to arts leaders, funders, policymakers, researchers, and the general public. The vision of DataArts is to build a national culture of data-driven decision making for those who want to see the arts and culture sector thrive. Its mission is to empower arts and cultural leaders with high-quality data and evidence-based resources and insights that help them to overcome challenges and increase impact. DataArts develops reports based on a uniquely comprehensive set of arts organizations’ data, integrating market-level data with organizational data from Theatre Communications Group, IRS 990s, and its own Cultural Data Profile. It assesses the industry from multiple perspectives; it determines what drives health from the organization’s operating conditions and its community’s characteristics; its KIPI Dashboard allows arts organizations to examine their health relative to similar organizations nationally on 24 indices. Publications include white papers on working capital, culturally specific arts organizations, workforce and audience demographics, and others, as well as reports on the health of the U.S. arts and cultural sector and the Arts Vibrancy Index Report, which highlights the 40 most arts-vibrant communities around the country.
About Theatre Communications Group
Theatre Communications Group (TCG) exists to strengthen, nurture, and promote professional theatre in the U.S. and globally. Since its founding in 1961, TCG’s constituency has grown from a handful of groundbreaking theatres to over 700 Member Theatres and affiliate organizations and nearly 10,000 Individual Members. TCG offers its members networking and knowledge-building opportunities through research, communications, and events, including the annual TCG National Conference, one of the largest nationwide gatherings of theatre people; Theatre Facts—the only in-depth report examining the attendance, performance, and overall fiscal state of the U.S. professional not-for-profit theatre field; the award-winning American Theatre magazine, and ARTSEARCH®, the essential source for a career in the arts. TCG is North America’s largest independent trade publisher of dramatic literature, with 17 Pulitzer Prizes for Drama on its booklist. Through the Global Theater Initiative, a partnership with the Laboratory for Global Performance and Politics, TCG also serves as the U.S. Center of the International Theatre Institute. In all of its endeavors, TCG seeks to build a more equitable, diverse, and inclusive theatre field; cultivate and celebrate the artistic talent and achievements of the field; and promote a larger public understanding of, and appreciation for, the theatre.
References:
[1] National Bureau of Economic Research, Inc. https://www.nber.org/cycles/cyclesmain.html. Accessed 20 July 2019.
[2] National Bureau of Economic Research, Inc. https://www.nber.org/cycles/sept2010.html. Accessed 21 July 2019.
[3] Based on data from the International Trade Commission, the average effective tariff rate on U.S. imports increased from 1.4% during January – April 2018, the period prior to the first tariff increases, to 2.5% in 2019. For imports from China, the corresponding increase was from 2.6% to 7.5%. The tariff increases on Chinese products were spread over a broad spectrum of goods, both intermediate and final products.
[4] The adjustment for inflation is based on compound annual average changes in the Consumer Price Index for all urban consumers as reported by the U.S. Department of Labor’s Bureau of Labor Statistics.
[5] Resident attendance figures include those who paid or attended free of charge. The number of single tickets sold and number of subscription tickets sold do not include complimentary tickets.
[6] Contributed income refers to unrestricted donations/grants for operating and non-operating purposes as well as net assets released from temporary restriction (NARTR)—i.e., assets that were released into the unrestricted fund during the fiscal year by the satisfaction of donor-imposed time or purpose restrictions.
[7] Excluding these three theatres from the analyses would leave the trend in government smoother and growth at 44% over time, heavily driven by local funding increases.
[8] Thomas, Rebecca and Zannie Voss, Five Steps to Healthier Working Capital, National Center for Arts Research, April 2018. https://sites.smu.edu/Meadows/WC-532018-Final.pdf
[9] Kaiser, Michael M. The Art of the Turnaround: Creating and Maintaining Healthy Arts Organizations. Lebanon, NH: University Press of New England, 2008, p 4.